Login to Ask a Question or Reply
You must be logged in to post your query.
Home › Forums › Chart Support › Tooltip multiline chart
Tooltip multiline chart
- This topic has 10 replies, 2 voices, and was last updated 5 years, 4 months ago by
Nerviozzo96.
Tagged: tooltip
-
March 7, 2021 at 7:50 am #32992
Hi there i have a problem when 2 data of 2 different series have same value because tooltip only show 1 of them. I cant use shared option beacuse i have so many series so tooltip becomes kinda useless in that case. I need show only the dataseries of points wich im hovering or point which are close enought.
I made a jsfiddle:
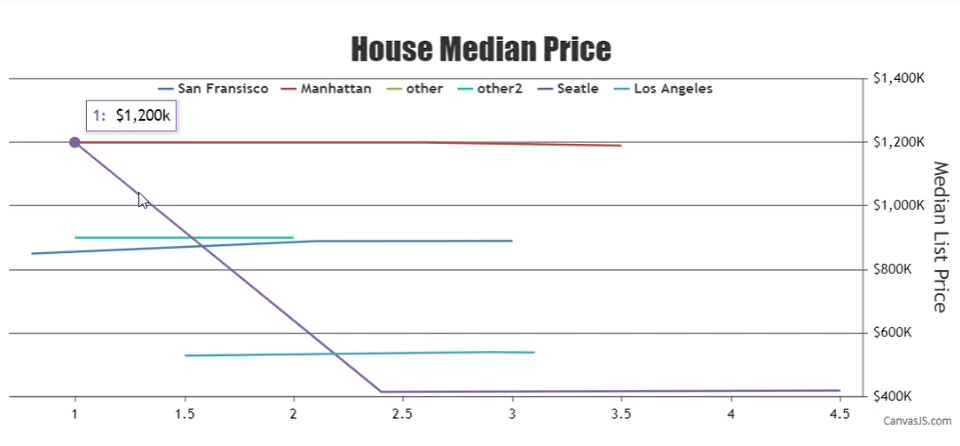
https://jsfiddle.net/JohnCarranza/6vyphafz/14/March 9, 2021 at 8:59 pm #33113In case of line and area charts when you mouse hover on a specific series it gets highlighted. Hence, the toolTip is shown for the highlighted series based on the x-value of the nearest dataPoint to the mouse pointer position, even if, dataPoint of any other dataSeries are near to the cursor position. For example, if the series “Seatle” is highlighted then toolTip of the corresponding series would be shown based on the mouse pointer position to the nearest dataPoint. Please check the below screenshot for a reference –
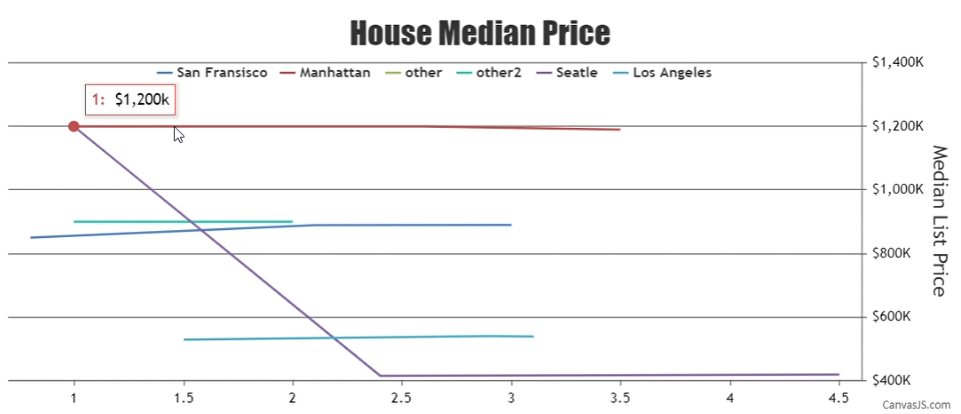
If the mouse pointer is shifted over a different series then the other series would be highlighted and toolTip for the other series would be shown. Please refer to the below screenshot for the same –
Based on the JSFiddle shared by you I would suggest you to use a shared toolTip.
___________
Indranil Deo
Team CanvasJSMarch 10, 2021 at 2:22 pm #33162I tried to reply 3 times, but i dont know why my reply dont get saved….lets try again..
As you see here jsfiddle shared tooltip becomes kinda useless, because shows “no needed” data if i want to know some point (i.e. “San Francisco”).
And with not shared tooltip i cant see both “San francisco” and “Valencia” series because they have some same points..-
This reply was modified 5 years, 4 months ago by
-
This reply was modified 5 years, 4 months ago by
-
This reply was modified 5 years, 4 months ago by
March 10, 2021 at 2:47 pm #33157Im gonna show you my exact problem in JSFiddle and why i cant use shared.
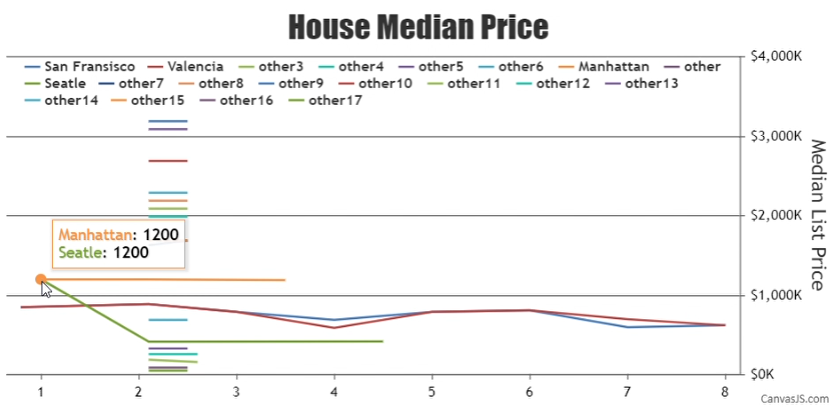
https://jsfiddle.net/JohnCarranza/6vyphafz/24/As you see here, i use tooltip shared and i want to know the data on (2.1 axisY) of “San Francisco” or “Valencia”, the tooltip becomes kinda usless because shows a huge tooltip whit a lot of “not desired” data.
And if i use tooltip not shared:
https://jsfiddle.net/JohnCarranza/6vyphafz/27/I cant see both “San franciso” and “Valencia” because they have same value and I can only see 1 if them (“San franciso” in this case).
So what I want to know is if there are any option to show (with not shared tooltip) 2 o more different series if there are on close range.
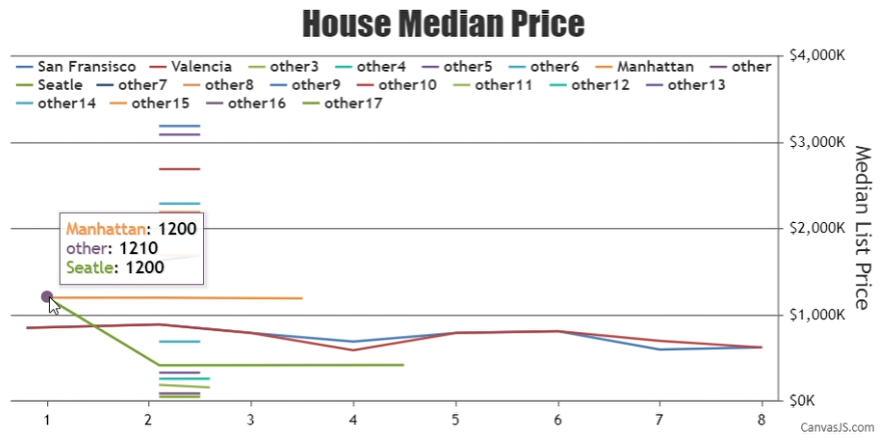
March 12, 2021 at 5:57 am #33227You can modify the content of toolTip using contentFormatter to display each dataPoints having the same x and y values in a single toolTip. Please check the below code snippet for customizing the content of toolTip –
toolTip: {
  contentFormatter: function(e){
    var content = "", dataPoint;
    for (var i = 0; i < e.chart.data.length; i++) {
      dataPoint = e.chart.data[i].dataPoints[e.entries[0].index];
      if(dataPoint && dataPoint.x === e.entries[0].dataPoint.x && dataPoint.y === e.entries[0].dataPoint.y){
        content += "<span style='color:" + e.chart.selectedColorSet[i] + "'>" + e.chart.data[i].name + "</span>: " + "<strong>" + dataPoint.y + "</strong>";
        content += "<br/>";
      }
    }
    return content;
  }
},
Also, kindly take a look at this JSFiddle for a working example.
___________
Indranil Deo
Team CanvasJSMarch 12, 2021 at 1:42 pm #33228Oh thanks! I already tried with contentFormatter, but didnt get to that point. Would this code help me to also show those that have a close X value?
Actually I need to show those which are close range in px not in value, this is possible?March 15, 2021 at 9:26 pm #33251You can show the dataPoints that are close to each other by selecting the dataPoints that fall within a specific range to the mouse pointer position. You can define the range by setting the following variables –
var yRange = 100;
var xRange = 10;
Then inside the toolTip contentFormatter you can display the dataPoints that fall within the given range as shown below –
toolTip: {
  contentFormatter: function(e){
    var content = "", dataPoint;
    toolTipXValue = e.entries[0].dataPoint.x;
    toolTipYValue = e.entries[0].dataPoint.y;

    for (var i = 0; i < e.chart.data.length; i++) {
      dataPoint = e.chart.data[i].dataPoints[e.entries[0].index];
      if(dataPoint && (toolTipYValue - yRange) <= dataPoint.y && dataPoint.y <= (toolTipYValue + yRange) && (toolTipXValue - xRange) <= dataPoint.x && dataPoint.x <= (toolTipXValue + xRange)){
        content += "<span style='color:" + e.chart.selectedColorSet[i] + "'>" + e.chart.data[i].name + "</span>: " + "<strong>" + dataPoint.y + "</strong>";
        content += "<br/>";
      }
    }
    return content;
  }
},
Please take a look at this JSFiddle for the complete code.
___________
Indranil Deo
Team CanvasJSMarch 15, 2021 at 9:28 pm #33252WOW thanks a lot! Im trying right now!
March 16, 2021 at 5:13 pm #33327Hi there, I thought this example was for range in pixels but actually is for range in values… Is not a bad option but is there any option for range in pixels?
March 17, 2021 at 11:42 pm #33435Yes, you can also check the range in pixels by converting the dataPoints x and y-value to pixel using convertValueToPixel() as shown in the code snippet below –
toolTip: {
  contentFormatter: function(e){
    var content = "", dataPoint, yWithinRange, xWithinRange;

    var toolTipXValue = e.chart.axisX[0].convertValueToPixel(e.entries[0].dataPoint.x);
    var toolTipYValue = e.chart.axisY2[0].convertValueToPixel(e.entries[0].dataPoint.y);

    for (var i = 0; i < e.chart.data.length; i++){

      dataPoint = e.chart.data[i].dataPoints[e.entries[0].index];

      if(dataPoint){

        yWithinRange = ((toolTipYValue - yRange) <= e.chart.axisY2[0].convertValueToPixel(dataPoint.y) && e.chart.axisY2[0].convertValueToPixel(dataPoint.y) <= (toolTipYValue + yRange));

        xWithinRange = ((toolTipXValue - xRange) <= e.chart.axisX[0].convertValueToPixel(dataPoint.x) && e.chart.axisX[0].convertValueToPixel(dataPoint.x) <= (toolTipXValue + xRange));

        if(yWithinRange === true && xWithinRange === true){

          content += "<span style='color:" + e.chart.selectedColorSet[i] + "'>" + e.chart.data[i].name + "</span>: " + "<strong>" + dataPoint.y + "</strong>";
          content += "<br/>";
        }
      }
    }
    return content;
  }
},
Also, kindly take a look at this JSFiddle for a working example with sample code.
___________
Indranil Deo
Team CanvasJSMarch 22, 2021 at 10:04 pm #33613Thanks a lot! Im trying this!
-
This reply was modified 5 years, 4 months ago by
Tagged: tooltip
You must be logged in to reply to this topic.