You must be logged in to post your query.
Home › Forums › Chart Support › Sync ToolTip problem when not the same X axis datapoints
Tagged: ToolTip Sync
Hello,
I have a problem to sync Tooltip when the charts don’t have the same X axis datapoints; tooltip is not displayed on charts if no datapoint behind the X axis value => “charts[j].toolTip.showAtX(e.entries[0].xValue”.
In your exemple “Sync ToolTip across Multiple JavaScript Charts ” if you remove some points of one of the charts you should see the problem withe the tooltip synch.
The behaviour I expected is to see the tooltip of the X axis datapoint the closest of the “xValue” but not nothing.
Thanks
Nicolas
Nicolas,
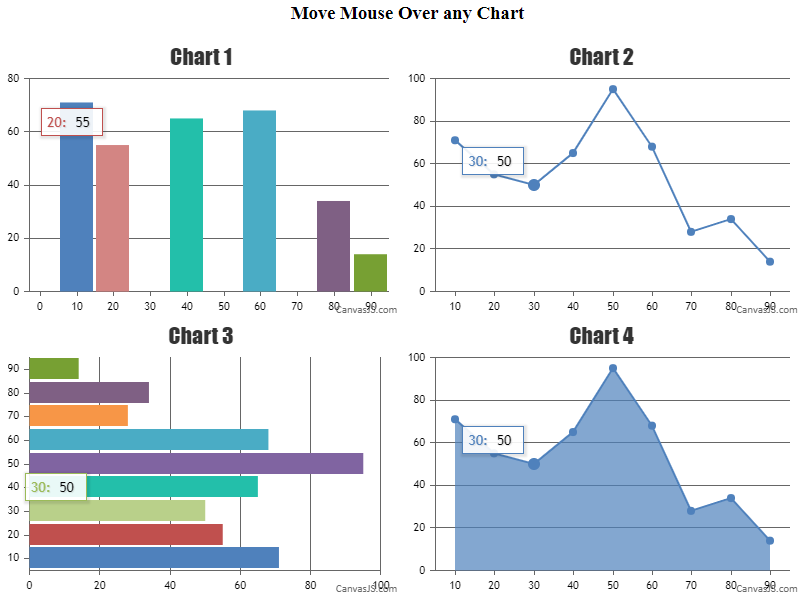
tooltip.showAt() shows the tooltip for specified x value passed as parameter not to nearest x value. In order to show tooltip to nearest x value, you can find the nearest x value and pass it in showAt method to display it. Please take a look at below code snippet for showing tooltip for nearest x value.
function getNearestXValues(xVal, dps1) { return [].concat(dps1).sort(function(a, b) { var diffA = Math.abs(xVal - a.x); var diffB = Math.abs(xVal - b.x); return diffA - diffB; // sort a before b when the distance is smaller })[0].x; } function showTooltip(e) { for( var i = 0; i < charts.length; i++){ if(charts[i] != e.chart) { charts[i].toolTip.showAtX(getNearestXValues(e.entries[0].xValue, charts[i].data[0].dataPoints)); } } }
Also, check out this JSFiddle for complete working code.
—- Manoj Mohan Team CanvasJS
It’s better but the problem is not solve completely. I change the jsfiddle to add more datapoints :
https://jsfiddle.net/8xn4qhou/
If we navigate on shart 2 ( from X 10 to X 60 ) the tooltip on chart 4 are not good.
Thx
We achieve the tooltip syncing using updated event and showAtX method of tooltip. Whenever tooltip of any chart is updated, the updated event of tooltip for that respective chart is called and we use e.entries[0].xValue i.e. dataPoint x value to display tooltip at respective x value on every chart. In the example you have shared, the chart 2 there is no dataPoint between 10 and 60 because of which updated event passes x value as 10 or 60 to display other charts based on mouse movement.
You must be logged in to reply to this topic. Login/Register