@hanojbudime,
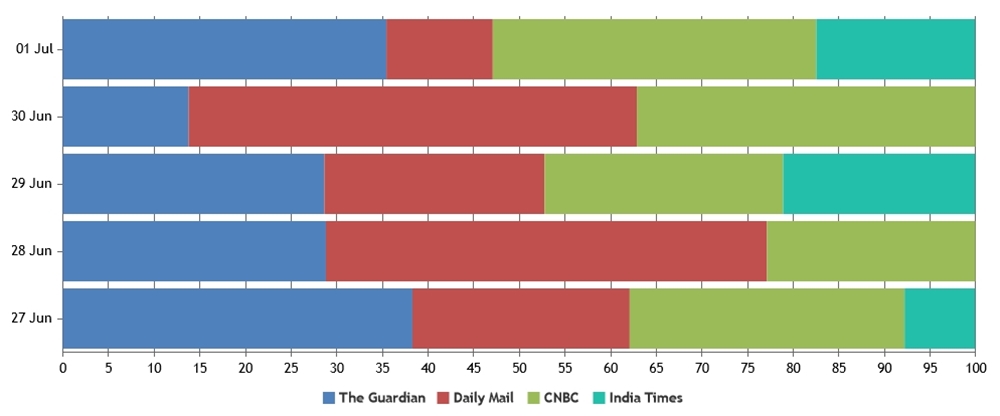
1) Look at my stacked-bar-chart y-axis label is repeating why ? jsfiddle
In case of Stacked Bar Chart, multiple bars with aligned x values are plotted on same axis & not based on labels. Passing x-values should work fine in this case. Also, we suggest you to use legend instead of indexLabels to denote the name of news-media & to use shared tooltip to make visualization better. Please take a look at this updated JSFiddle with above mentioned changes.

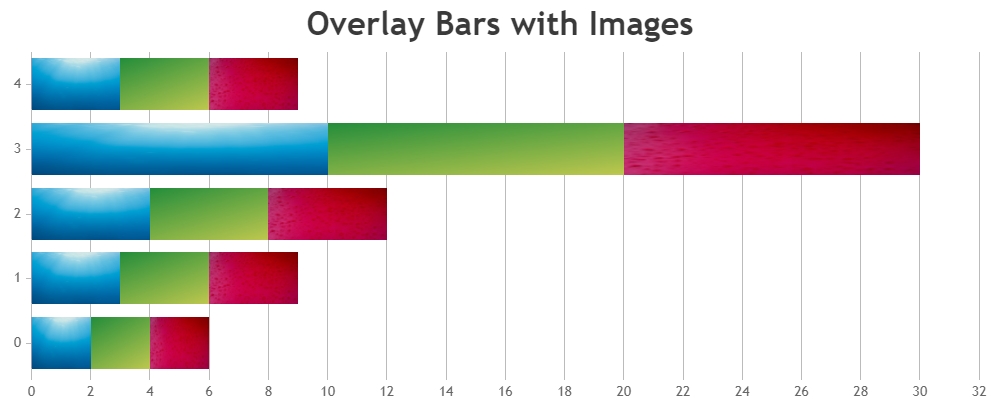
2) How to add image on each stack bar like (each color on that bar should be image of that dataPoint)
Please take a look at this documentation page for step-to-step tutorial on positioning image on top of chart. This JSFiddle shows an example on positioning image over each bar in Stacked Bar Chart.

Also refer to this Gallery Page & this JSFiddle for more examples on positioning image on top of chart along with complete code.
—
Vishwas R
Team CanvasJS

