@wellhys,
If you looking to set the minimum and maximum value of x-axis of individual chart with date-time axis, you can achieve it by setting the minimum and maximum property of axisX in charts. Please check out the below code snipppet for same.
{
	.
	.
	charts: [{
		axisX: {
			minimum: new Date(2018, 00, 01, 09, 30),
			maximum: new Date(2018, 03, 01, 09, 30)
		},
		.
		.
	}]
}
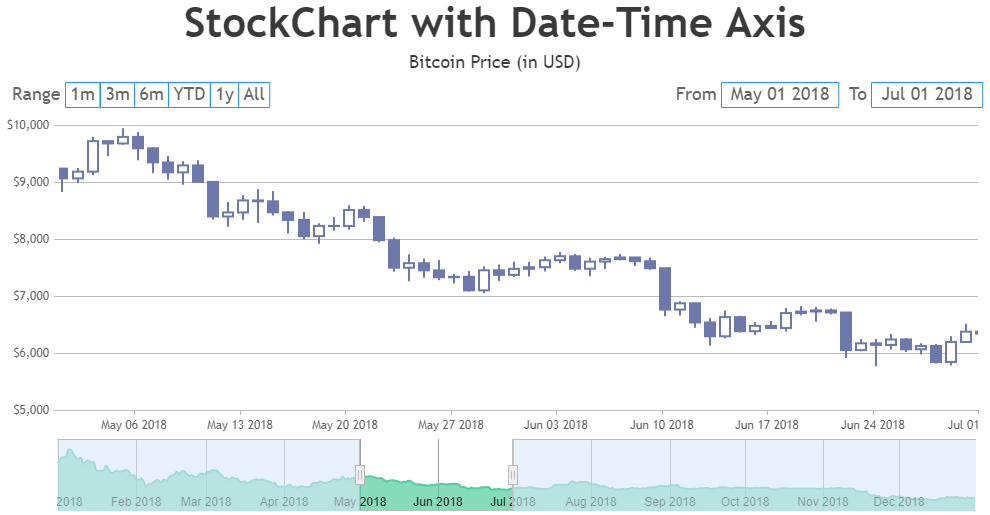
Setting the minimum and maximum of slider sets the range of all charts and synchronise them. Please check out the below code snippet for the same.
{
	.
	.
	navigator: [
		slider: {
			minimum: new Date(2018, 00, 01, 09, 30),
			maximum: new Date(2018, 03, 01, 09, 30)
		},
		.
		.
	]
}
To specify hour component, you can pass the datetime value along with time component like new Date(2018, 00, 01, 09, 30) to minimum and maximum values. For more information on passing time component within date-time values, please refer to this MDN documentation.
—–
Manoj Mohan
Team CanvasJS
.