Home Forums Chart Support Replace Xcelsius

Replace Xcelsius

Viewing 2 posts - 1 through 2 (of 2 total)
  • #34355

    Xcelsius and Spreadsheetconverter transform excel to a dashboard with graphs. Very popular.

    CanvasJS has much better graphs

    Maybe everything can be done with canvasJS and javascript instead.

    It would be very interesting as a jump-start to see more examples, especially to generate graphs with formulas.
    I am looking for these kind of examples:

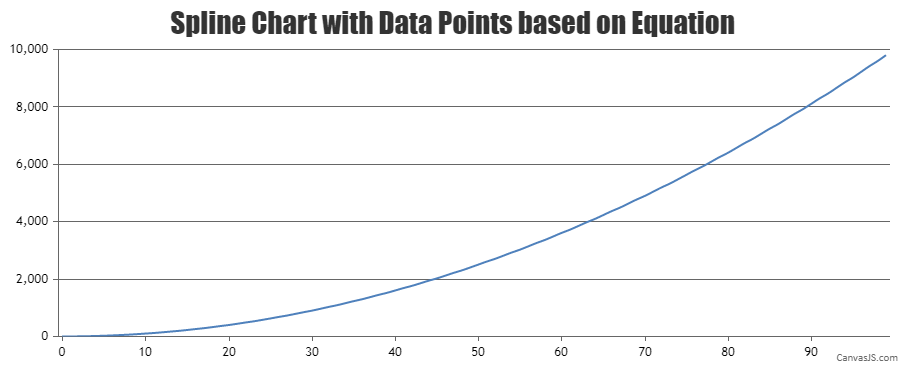
    Suppose you have 7 sliders giving values a,b,c,d,e,f,g and generate a canvasJS line graph plot from the function

    y= a*sin(b*x)^c x-range d-e y range f-g

    This or any such example would be of much help to learn the necessary javastript !

    #34368

    @benove,

    You can generate the dataPoints(x and y-values) based on your formula and render the chart using same. Please check out the below code snippet for generating chart dataPoints using formula –

    for (var j = 0; j < dataLength; j++) { 
      xVal = j;
      yVal = Math.pow(xVal,2) +  1;
      dps.push({
        x: xVal,
        y: yVal
      });      
    }

    Please take a look at this JSFiddle for a working example.

    Chart with dataPoints from equation

    ___________
    Indranil Deo
    Team CanvasJS

Viewing 2 posts - 1 through 2 (of 2 total)

You must be logged in to reply to this topic.