Home Forums Chart Support Position the chart lines, add bottom padding

Position the chart lines, add bottom padding

Viewing 3 posts - 1 through 3 (of 3 total)
  • #36755

    Hi,

    I have a chart with multiple y-axis. I will add multiple lines dynamically. I want to add some padding in the bottom for chart lines if the line have minimum values in the data points. Sometimes its hard to read if the line plotted at the bottom.

    I have sample jsfiddle. One line is plotted bottom of the chart. Its very hard to read. I want those line should be plotted with some padding in the bottom. How can I do this? How to change that line position?

    #36767

    @ragu1991nathan,

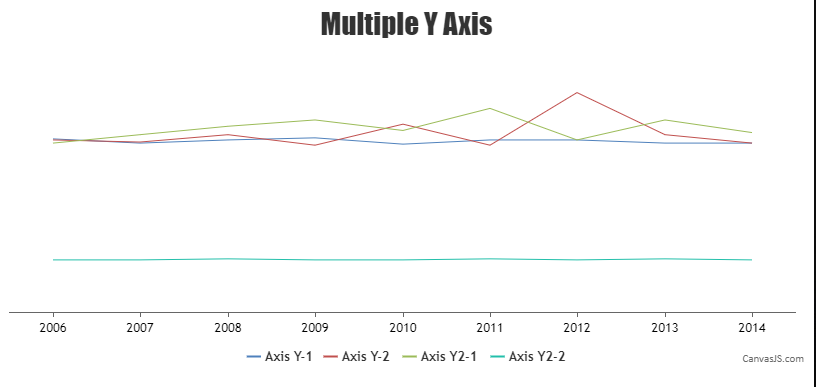
    Based on the minimum y-value among all the data series, you can set the minimum for Y-axis to add some space beneath the line chart as shown in the code-snippet below,

    function setYMin() {
      var yMinValue = 0;
      for(var i = 0; i < chart.options.data.length; i++) {
        for(var j = 0; j < chart.options.data[i].dataPoints.length; j++) {
          yValues.push(chart.options.data[i].dataPoints[j].y)
        }
      }
      yMinValue = Math.min(...yValues);
      chart.axisY[0].set("minimum", yMinValue - chart.axisY[0].get("interval"))
    }

    Kindly take a look at this updated JSFiddle for an example on the same.

    setting minimum value for axisY


    Adithya Menon
    Team CanvasJS

    #36770

    Thank you so much.

    Setting a “minimum” to charts is do the things. I will try the same in my code. Thanks again!

Viewing 3 posts - 1 through 3 (of 3 total)

You must be logged in to reply to this topic.