Home Forums Chart Support How to hide indexLebel value if zero globally for all charts in v3.2.2

How to hide indexLebel value if zero globally for all charts in v3.2.2

Viewing 3 posts - 1 through 3 (of 3 total)
  • #35053

    Hi there,

    I have just upgraded CanvasJS library from v3.0 to v3.2.2
    But I face issue that is is showing 0 0 0 0 on chart when no values for Y axes. it was all good on v3.0
    Though, I can hide it through function by checking values, but I have lots of charts and it is very time consuming process.
    So, can anyone please suggest global fix for it, to hide 0 0 0 0 from all charts of my website?

    Thank you,

    #35067

    @ketanajudiya,

    The use case you mentioned of indexLabel not being shown when y value is 0 was a bug and it has been fixed in the releases prior to 3.0. In order to hide indexlabel when y value is 0, you need to use indexLabelFormatter property.

    So, can anyone please suggest global fix for it, to hide 0 0 0 0 from all charts of my website?

    Sorry, as of now you cannot revert this behaviour globally. However, you can create a global function which takes chart object as parameter and set the indexLabelFormatter in the chart options and render it as shown in this code snippet.

    addIndexLabelFormatterToChart(chart);
    
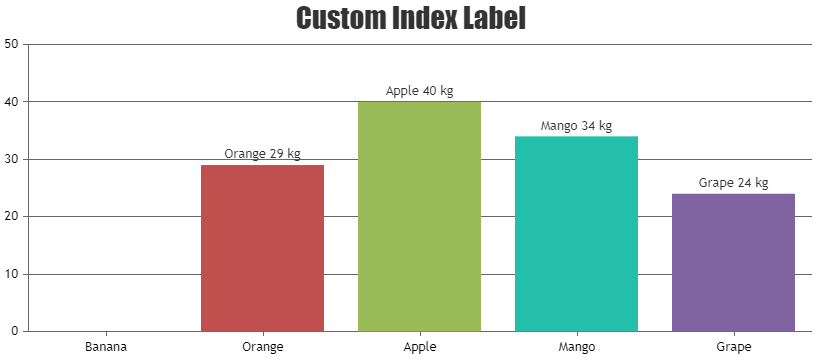
    function hideIndexLabelOnZero(e) {
    return e.dataPoint.y !== 0 ? e.dataPoint.label + " " + e.dataPoint.y + " " + "kg": "" ;
    }
    
    function addIndexLabelFormatterToChart(chart) {
    chart.data[0].set("indexLabelFormatter", hideIndexLabelOnZero);
    
    }

    Also, check out this JSFiddle for complete working code.

    Hiding indexLabel when y value is 0

    —-
    Manoj Mohan
    Team CanvasJS

    #35070

    Hi Manoj,

    Thank you for your reply, I have managed to hide 0 in data points values. I have made it blank when passing value 0 to charts.

Viewing 3 posts - 1 through 3 (of 3 total)

You must be logged in to reply to this topic.