Login to Ask a Question or Reply
You must be logged in to post your query.
Home › Forums › StockChart Support › How to change Navigation range accordingly to range selection
How to change Navigation range accordingly to range selection
- This topic has 5 replies, 2 voices, and was last updated 4 years ago by
Manoj Mohan.
-
June 25, 2022 at 3:30 pm #38279
Hi, i started using these charts and i find them very customizable and inthuitive.
I already did much using the documentation on this site but there’s still one thing i’m not able to reach and i hope you can help me.I customized a StockChart that at the moment takes data from a php file with data starting from September 2021 up to now.
On top of the chart i have a range selector with these options:
– 24h
– 1 week
– 1 month
– 6 months
– YTD
– ALLand under the chart i have the very helpfull navigation bar that contains the small chart trend representation with of ALL the data returned by the php (that means since september 2021).
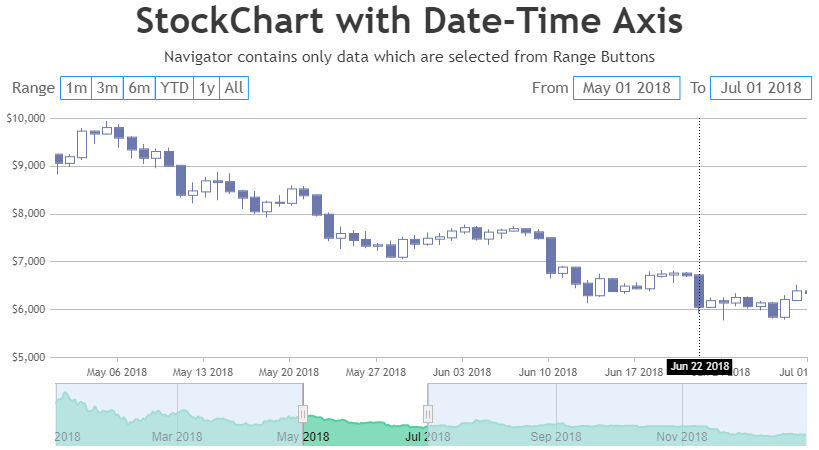
What i’m asking if it’s possinble is when user clicks on some range (eg: 1 month) the navigation bar will be filled JUST with the data coming from the last month instead of ALL the data since September 2021 and within this selected month i can use the sliders to set a portion of this month data (eg: 3 days).
I hope I have explained, if not plesae ask for more details and i’ll be back to you with more information
June 28, 2022 at 6:07 pm #38284To better understand the question, you can use the standard Template JSFiddle at this link:
https://jsfiddle.net/canvasjs/02zu4fd6/
When selecting (for example) the 3m range, i’d like to see the navigation bar to stretch to contain JUST those 3 months data instead of the overall data
June 28, 2022 at 7:48 pm #38297You can update the dataPoints of navigator to show only dataPoints which are in selected range on click of range buttons using rangeChanged event. Please take a look at below code snippet for updating the datapoint based on the selected range in rangeChanged event.
function rangeChanged(e) {
    var minimum = parseInt(e.minimum);
    var maximum = parseInt(e.maximum);

    if (e.source == "buttons") {
        stockChart.options.charts[0].data[0].dataPoints = dps1 = [];
        stockChart.options.navigator.data[0].dataPoints = dps2 = [];

        for (var date in completeDPS) {
            if (
                ((date >= minimum && date <= maximum) || e.index == 5) &&
                completeDPS.hasOwnProperty(date)
            ) {
                dps1.push(completeDPS[date]);
                dps2.push({
                    x: completeDPS[date].x,
                    y: completeDPS[date].y[3],
                });
            }
        }
        stockChart.render();
    }
}
Please take a look at this JSFIddle for an example on the same.
Also, Ranges of range buttons are dependent on the datapoints present in navigator. Hence, updating the datapoints of navigator may result in disabling some of the range buttons whose ranges are outside the range of datapoints present in navigator.
—
Manoj Mohan
Team CanvasJSJune 30, 2022 at 3:47 am #38328First of all, thanks for your reply, i managed to get the navigation bar resizing when selecting different range buttons.
Unfortunatelly this has introduced some bad behaviour that i had not before these changes, i’ll list below:– before the modification you suggested, when the chart was rendered the first time i set the rangeSelector property “selectedRangeButtonIndex: 2” so the button with index 2 was selected. But now, setting this button using that property, the event “rangeChanged” is not triggered. Should i force this event via code so when the chart is loaded with button index 2 selected the navigation bar is set accordingly or there’s another way to do this?
– when selecting a different button, inside the rangeChanged(e) function i set these 2 properties:
// my intention was to set the new button as the selected one
stockChart.rangeSelector.selectedRangeButtonIndex = e.index;// and change the color of the new button
stockChart.rangeSelector.buttonStyle.set(“backgroundColorOnSelect”, “#ff9800”);My intention is to remove custom color from the “old” button and assign to the new selected. With the 2 commands above the new button is colored with my custom color, but as soon as i move the mouse, the color is reverted to white
– In order to see again ALL the chart data i need to click TWICE the “ALL” button in range selector, and this happen also in your JDIfiddle example above. Try selecting, the first time the page is loadedm range 3 months and then the ALL button. You’ll see that the first time will change just the navigation bar, and with a second click also the chart data will change accordingly.
thanks, your help is much appreciated
July 1, 2022 at 7:27 pm #38355– before the modification you suggested, when the chart was rendered the first time i set the rangeSelector property “selectedRangeButtonIndex: 2” so the button with index 2 was selected. But now, setting this button using that property, the event “rangeChanged” is not triggered. Should i force this event via code so when the chart is loaded with button index 2 selected the navigation bar is set accordingly or there’s another way to do this?
rangeChanged event is triggered only when the range of the StockChart is changed manually using mouse/pointer (zooming/panning/sliding) and it doesn’t trigger when range of StockChart are set programmatically. However, you can manually call rangeChanged event handler after rendering the chart with required parameter as shown in this code snippet.
rangeChanged({minimum: stockChart.navigator.slider.minimum, maximum: stockChart.navigator.slider.maximum, source: "buttons" })– when selecting a different button, inside the rangeChanged(e) function i set these 2 properties:
// my intention was to set the new button as the selected one
stockChart.rangeSelector.selectedRangeButtonIndex = e.index;// and change the color of the new button
stockChart.rangeSelector.buttonStyle.set(“backgroundColorOnSelect”, “#ff9800”);In order to set selectedRangeButtonIndex, either you can use set method or update the stockchart options. Please take a below code snippet for the same.
stockChart.rangeSelector.set("selectedRangeButtonIndex", e.index);or
stockChart.options.rangeSelector.selectedRangeButtonIndex = e.index;– In order to see again ALL the chart data i need to click TWICE the “ALL” button in range selector, and this happen also in your JDIfiddle example above. Try selecting, the first time the page is loadedm range 3 months and then the ALL button. You’ll see that the first time will change just the navigation bar, and with a second click also the chart data will change accordingly.
We are looking into your query and will get back to you at the earliest.
—-
Manoj Mohan
Team CanvasJSJuly 4, 2022 at 10:01 pm #38368– In order to see again ALL the chart data i need to click TWICE the “ALL” button in range selector, and this happen also in your JDIfiddle example above. Try selecting, the first time the page is loadedm range 3 months and then the ALL button. You’ll see that the first time will change just the navigation bar, and with a second click also the chart data will change accordingly.
To show all the chart data, you can set the slider’s minimum and maximum to null in rangeChanged event handler. Please take a look at this JSFiddle for an example on the same.
—-
Manoj Mohan
Team CanvasJS
You must be logged in to reply to this topic.