Login to Ask a Question or Reply
You must be logged in to post your query.
Home › Forums › Report Bugs › Graphs not displaying correctly on Chrome
Graphs not displaying correctly on Chrome
- This topic has 8 replies, 2 voices, and was last updated 10 years ago by
Vishwas R.
-
May 16, 2016 at 9:32 pm #10495
I have my graph configured to get data from a database and it’s all set up correctly with all the data displaying as it should. I have also configured 2 tabs which switch the graphs from line to bar for convienience which works fine. However, I now have a problem where the graphs are completely messed up on Chrome but work fine on Firefox and IE!
This is the code for the graph.
var chart = new CanvasJS.Chart(“chartContainer”,
{
animationEnabled: true,
axisX:{gridColor: “Silver”,
tickColor: “silver”,
labelAngle: -50},
toolTip:{
shared:true
},
axisY: {
gridColor: “Silver”,
tickColor: “silver”
},
legend:{
verticalAlign: “bottom”,
horizontalAlign: “center”,
fontFamily: “Expressway-Rg”
},
data: [
{
type: “line”,
showInLegend: true,
lineThickness: 2,
name: “Orders Week Ending ” + “@Html.Raw(Model.OrdersWeekEnding)”,
markerType: “square”,
color: “#cc0000”,
dataPoints:@Html.Raw(Model.WeekEndingJson)
},
{
type: “line”,
showInLegend: true,
name: “Orders Week Ending ” + “@Html.Raw(Model.ComparisonOrdersWeekEnding)”,
color: “#000000”,
lineThickness: 2,
dataPoints:@Html.Raw(@Model.ComparisonWeekEndingJson)
}
]});
chart.render();
Thanks in advance to anyone that can help!
May 17, 2016 at 12:49 pm #10497May 17, 2016 at 1:32 pm #10499This is the JSFiddle of the graph with data.
http://jsfiddle.net/kvgzzsvp/3/
I’ve also surrounded it with window.onload = function() {}, could this be the reason it’s messing up on chrome?
Thanks for the reply!May 17, 2016 at 2:44 pm #10500Callam,
We observed that the JSFiddle you have created seems to be working fine across all browsers.
If the issue persists, kindly share the OS details along with chrome version you are using so that we can test it, understand the scenario better and help you out.
—
Vishwas R
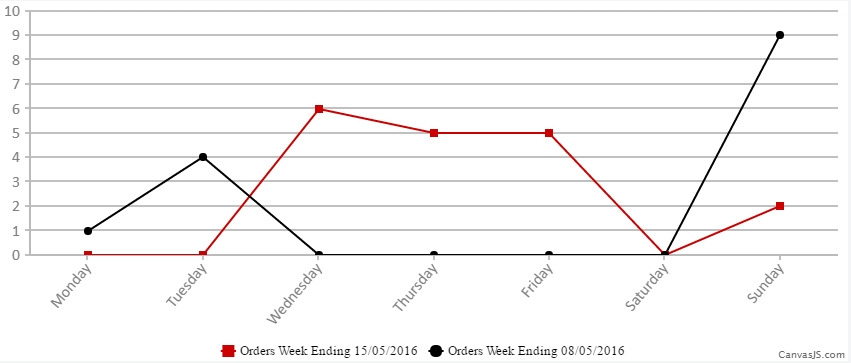
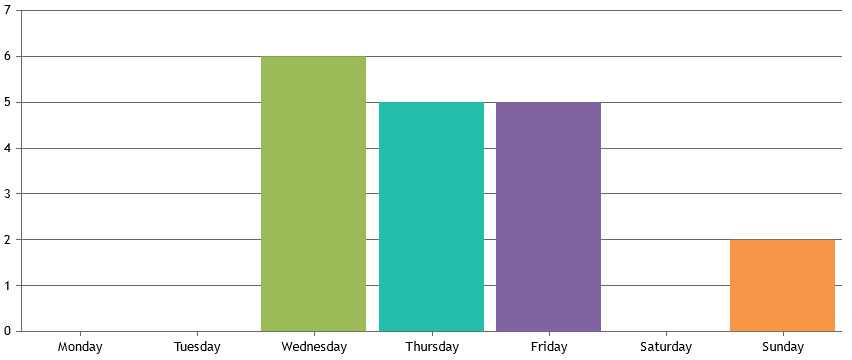
Team CanvasJSMay 17, 2016 at 4:12 pm #10501Here’s the screenshot for the graph on chrome and then this screenshot is the exact same link and graphs but on firefox.
May 17, 2016 at 4:12 pm #10502I’m also on windows 10, using the latest version of chrome and firefox.
May 18, 2016 at 7:36 pm #10510Callam,
Earlier we had come across a similar issue with Chrome when Canvas is GPU accelerated (default). Google fixed the issue after sometime.
Please try disabling GPU accelerated rendering in Chrome and see if it helps.
—
Vishwas R
Team CanvasJSMay 31, 2016 at 5:19 pm #10657Callam,
Can you please try using this latest build and let us know if it worked.
—
Vishwas R
Team CanvasJSJune 7, 2016 at 3:37 pm #11310Callam,
We have just released v1.8.1 GA. Kindly download the latest version and let us know your feedback. Refer to the release blog for more information.
—
Vishwas R
Team CanvasJS
You must be logged in to reply to this topic.