Login to Ask a Question or Reply
You must be logged in to post your query.
Home › Forums › Chart Support › date time formatting issues
date time formatting issues
- This topic has 11 replies, 2 voices, and was last updated 10 years, 2 months ago by
Vishwas R.
-
April 17, 2016 at 2:16 pm #10150
Hi,
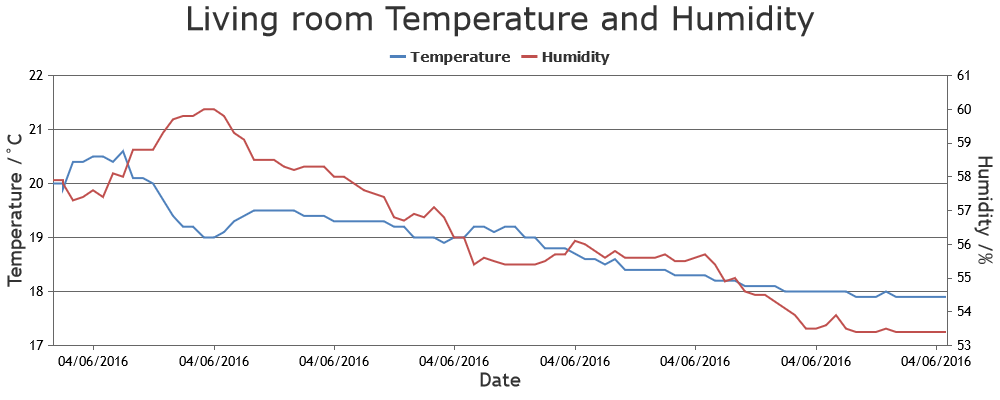
I’m plotting a graph of temp/humidity date against time, and the graph shows the time/dae in full ISO format when you mouse over it. I tried using valueFormatString to reduce this to just date and time (dd/mm/yyyy hh:mm), but it doesn’t work (doesn’t throw any errors either). I’m also trying to plot the labels on the x axis as just date (in a dd/mm/yyyy format) but this only functions for the initial date, and then reports the equivalent of a 0 (01/01/1970).
I thought it might be an issue with the formatting of my text in the csv file, so changed that to ISO format, as below.
Data is being read from a CSV file – format:
“2016-04-05 23:03:00,20.8,54.60%”Any help greatly appreciated!
fiddle of javascript
https://jsfiddle.net/4ve2ow2t/April 18, 2016 at 1:49 pm #10153In the JSFiddle that you have shared, we observe that the ISO-format for date-time that you are using is not proper [Correct Format – new Date(“YYYY-MM-DDTHH:MM:SS”)]. Also the csv file is missing, because of which we are unable debug / understand the use-case properly. Passing proper date-time values should work fine in your case. Please refer this documentation page for more information on using date-time values. Please take a look at this JSFiddle for an example on using date-time values.
—
Vishwas R
Team CanvasJSApril 18, 2016 at 2:45 pm #10156I couldn’t work out a way to upload the csv file, but it follows the format as below: (if you can tell me how to upload it to the fiddle I will)
2016-04-05 23:03:00,20.8,54.60%
Inputting that date format into your code works, and prints the date as expected, so I’m unsure as to why it won’t with my code using the same formatting values?
April 19, 2016 at 11:04 am #10162April 19, 2016 at 1:13 pm #10164Fiddle won’t let me use jquery.canvasjs.min.js as a http external resource (from here: https://cdn.canvasjs.com/jquery.canvasjs.min.js) so I can’t replicate the issue with my fiddle.
HOWEVER – copy and pasting my code incl the data into your fiddle replicates the issue. http://jsfiddle.net/4bc9v3hd/14/
Note how the tooltip shows the full ISO datetime (I am trying to make it show only the date and time) and the legend shows on 01/01/1970 for all points.
April 20, 2016 at 10:19 am #10172In the JSFiddle that you have shared, we observe that you are not providing x-values, because of which the date starts from Jan 1 1970 – as x-values are auto-assigned as 1,2,3,… internally. As the axis is dateTime axis, we suggest you to use intervalType along with interval to set the interval but to pass x-values.
Here is the working fiddle with formatted-labels in “DD/MM/YYYY” format.
—
Vishwas R
Team CanvasJSApril 20, 2016 at 11:35 am #10183Brilliant, that has fixed the x axis issue. However the toltip still shows the full ISO date – I tried using xValueFormatString in data or valueFormatString in axisX to format this as “DD/MM/YYYY HH:mm” but neither affect it. Am i trying to format it in the wrong way?
Thanks!
April 22, 2016 at 10:36 am #10331You can define the format of x-value shown in tooltip & indexlabels by setting xValueFormatString. However if you like to completely format / custom-content in the tooltip content, you can use toolTipContent.
—
Vishwas R
Team CanvasJSApril 22, 2016 at 11:20 am #10332What is the syntax for formatting toolTipContent – i.e. {label} shows the same effect, {label: ‘formatstring’} shows no specific formatting either?
April 22, 2016 at 1:09 pm #10333Further to that – using
toolTip: {contentFormatter: function(e) {return CanvasJS.formatDate(e.value, "DD/MM/YYYY HH:mm");},
formats it correctly, but removes the y value (and the{label}the value isnow. Addingcontent: "{label}: {y}"doesn’t add the y value either.April 22, 2016 at 1:18 pm #10336I’ve mostly resolved my issue now –
toolTip: { contentFormatter: function(e) { return CanvasJS.formatDate(e.entries[0].dataPoint.label, "DD/MM/YYYY HH:mm")+": "+e.entries[0].dataPoint.y; },
http://jsfiddle.net/4bc9v3hd/27/Displays the text formatted correctly.
Could you point me in the direction of the colours etc to make it match the rest of theme1?
May 5, 2016 at 11:56 am #10389You can customize & style the tooltip to fit in your requirements using properties like borderColor, fontColor and backgroundColor.
toolTip: {
	borderColor: "#000000",
	backgroundColor: "#F4D5A6",
	fontColor: "#FAC003"
}
—
Vishwas R
Team CanvasJS
You must be logged in to reply to this topic.