Login to Ask a Question or Reply
You must be logged in to post your query.
Home › Forums › Chart Support › Date Format
Date Format
- This topic has 13 replies, 4 voices, and was last updated 7 years, 5 months ago by
Vishwas R.
Tagged: date format
-
May 30, 2018 at 7:05 pm #20923
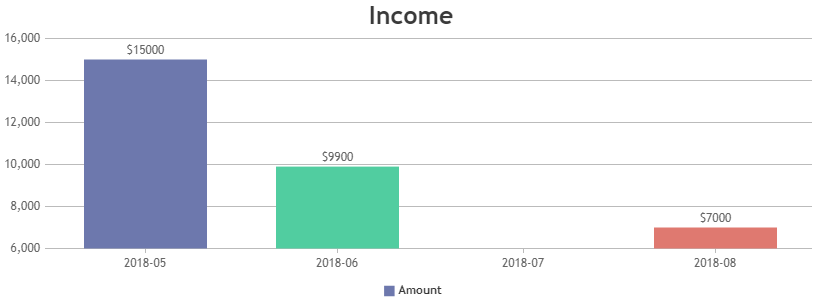
Hi, I have extracted data from database into this format:
array(4) { [0]=> array(2) { [“label”]=> string(7) “2018-05” [“y”]=> float(26350) } [1]=> array(2) { [“label”]=> string(7) “2018-06” [“y”]=> float(500) } [2]=> array(2) { [“label”]=> string(7) “2018-07” [“y”]=> float(0) } [3]=> array(2) { [“label”]=> string(7) “2018-09” [“y”]=> float(300) } }
When I build the chart, I noticed the month “2018-08” is missing because there’s no data from database.
I wish make the X-axis to show the month properly. Can I know how to edit my script so the month can display properly? I have seen this tutorial but have not figure out the solution yet. https://canvasjs.com/docs/charts/methods/canvasjs/format-date/
Please advise. Thanks.
May 31, 2018 at 10:27 am #20931If the month “2018-05” is occupying some space on chart, you can use scaleBreaks to remove the occupied space.
If this doesn’t solve your requirement, can you kindly create and share JSFiddle with sample data so that we can understand your requirement better and help you out.
__
Priyanka M S
Team CanvasJSMay 31, 2018 at 5:46 pm #20939Hi Priyanka,
I extracted the data from database using this tutorial:
https://canvasjs.com/php-charts/chart-data-from-database/The data looks like below:
dataPoints: [
{ x: 2018-05, y: 71 },
{ x: 2018-06, y: 55 },
{ x: 2018-07, y: 50 },
{ x: 2018-09, y: 65 },
]
Any way to show no data for 2018-08?
p/s: I’m not sure how to put it on jsfiddle
June 1, 2018 at 9:33 am #20950Can you please share a static HTML page over onedrive or Google drive, so that we can take a look at the chart options you are using, understand your scenario better and help you out?
__
Priyanka M S
Team CanvasJSJune 1, 2018 at 8:19 pm #20958Hi Priyanka,
Thanks for your reply :)
I have uploaded a simplified html file here:
https://goo.gl/s5ZdfTThere’s no data for July from the database, but I wish to show it on the chart…
June 4, 2018 at 10:33 am #20963June 4, 2018 at 4:29 pm #20966Hi Priyanka,
May I know how to put the new Date() into the array?
array_push($dataPoints, array(“x”=> $row->x, “y”=> $row->y));
I tried the below, it is not working:
array_push($dataPoints, array(“x”=> “new Date(\””.$row->x.”\”)”, “y”=> $row->y));
Thanks.
June 5, 2018 at 11:28 am #20968To display the chart containing datetime value in PHP, you need to first convert datetime string to PHP timestamp using strtotime(). Later convert PHP timestamp value to javascript timestamp and assign that value to dataPoint x-value along with setting xValueType to ‘dateTime’. Please take a look below code snippet for the same.
array_push($dataPoints, array("x"=> strtotime($row->x) * 1000, "y"=> $row->y));__
Priyanka M S
Team CanvasJSJune 6, 2018 at 5:36 pm #20986Hi Priyanka,
Thanks for your sharing, I’m able to get it display properly now :)
February 18, 2019 at 2:54 pm #24367Hi Priyanka,
After using your function : array_push($dataPoints, array(“x”=> strtotime($row->x) * 1000, “y”=> $row->y));
Now I get thoses numbers on my x-axis how do i change back to date format ?February 18, 2019 at 3:28 pm #24368Setting xValueType to ‘dateTime’ should work fine in your case, as you are passing timestamp as x-value. If this doesn’t solve your issue, kindly create a sample project and share it with us via Google-Drive or Onedrive so that we can look into the code, understand it better and help you out?
—
Vishwas R
Team CanvasJS
Tagged: date format
You must be logged in to reply to this topic.