Home Forums Chart Support Custom X Axis Order By (Asc/Desc)

Custom X Axis Order By (Asc/Desc)

Viewing 4 posts - 1 through 4 (of 4 total)
  • #33787

    Hi,

    How to arrange X-axis order using custom values, For example, I have 10-100 values in X-axis.
    In bar chart it shows 10,20,30,40,etc. in X axis but I want X value by customize like 30,10,40,20,etc. order
    For reference, https://jsfiddle.net/zr7wnuo8/

    How to do x-axis value in customizing order, Please help me in this regard.

    Thanks

    #33810

    @hannainstruments,

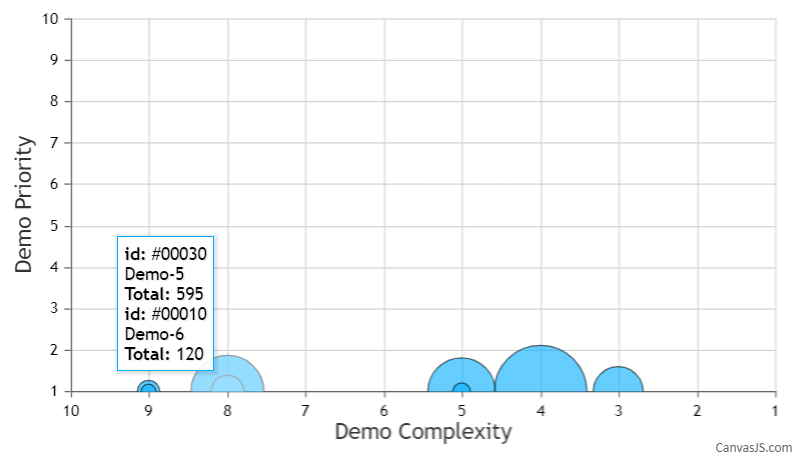
    The x-axis labels are auto-calculated and displayed according to the x-values that you have passed in a sequential order (ascending). If you would like to show the x-axis labels in a reverse order (i.e descending order), please take a look at the reversed property of axisX to achieve the same.

    As you have mentioned about having custom sequence, you can use labels instead of x-value. Kindly take a look at the code snippet below,

    data: [
          {
            type: "column",
            dataPoints: [
    
            { label: "30", y: 71},
            { label: "20", y: 55},
            { label: "10", y: 50},
            { label: "50", y: 65},
            { label: "40", y: 95},
            ]
          }
         ] 

    If the solution doesn’t fit your requirement, kindly brief us further on your requirement so that we can understand it better and help you out with the same.

    ___________
    Adithya Menon
    Team CanvasJS

    #33856

    Hi Adithya ,

    Thanks for the reply.

    One more question on the bubble chart of custom X value sequence arrangement, Please follow the link https://jsfiddle.net/06xqmb34/1/. In this link you will see in 8 X value and 5 X value there is bubble overlapping, on mouse-over on overlapping bubbles we can see the two tooltips with different values And on 9 X value there is also overlapping but we can see only one tooltip, How to resolve this issues. ?

    Thanks

    #33893

    @hannainstruments,

    Since the chart contains multiple dataPoints with the same x and y values, I would suggest you go to ahead with Multi Series charts to better visualize the data. In this case, you can use the shared property for toolTip as well, as shown in this code-snippet below,

    toolTip: {
       shared: true
    }, 

    Please take a look at this updated JSFiddle for an example on a multi-series bubble chart with shared toolTip

    multi series bubble chart with shared tooltip


    Adithya Menon
    Team CanvasJS

Viewing 4 posts - 1 through 4 (of 4 total)

You must be logged in to reply to this topic.