@alexg00,
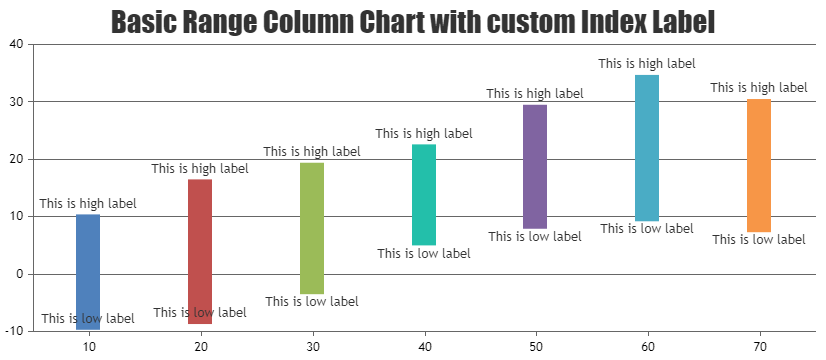
You can use indexLabelFormatter to show custom index labels as shown in the code snippet below.
indexLabelFormatter: function(e){
    if( e.index === 1)
     return "This is high label";
    else
     return "This is low label";
},
Please check this JSFiddle for an example of the same.
—
Rohith Nagaral
Team CanvasJS