Login to Ask a Question or Reply
Home › Forums › Chart Support › Tooltip not showing › Reply To: Tooltip not showing
May 10, 2022 at 6:05 pm
#37679
Ragu Nathan,
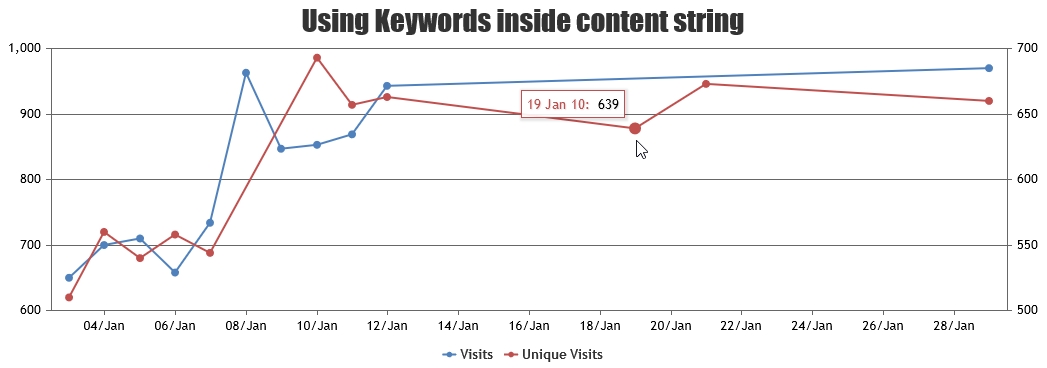
You can set toolTipContent to null in dataseries level to hide tooltip for particular dataseries when shared is set to false. Please take a look at this JSFiddle for an example.
However, the same can be done using contentFormatter as well. In this case, you will have to loop through all the entries & generate tooltip content to hide information related to one of the dataseries. Please find the code-snippet below.
contentFormatter: (e) => {
  var content = "";
  for(var i = 0; i < e.entries.length; i++) {
    if (e.entries[i].dataSeries.name != "Visits") {
      content += e.entries[i].dataSeries.name + " - " +  e.entries[0].dataPoint.y;
    }
  }
  return content === "" ? null : content;
}
Please take a look at this updated JSFiddle for complete code.

—
Vishwas R
Team CanvasJS