Login to Ask a Question or Reply
Home › Forums › Chart Support › How to show the time and date on xAxis › Reply To: How to show the time and date on xAxis
July 28, 2021 at 7:46 pm
#34965
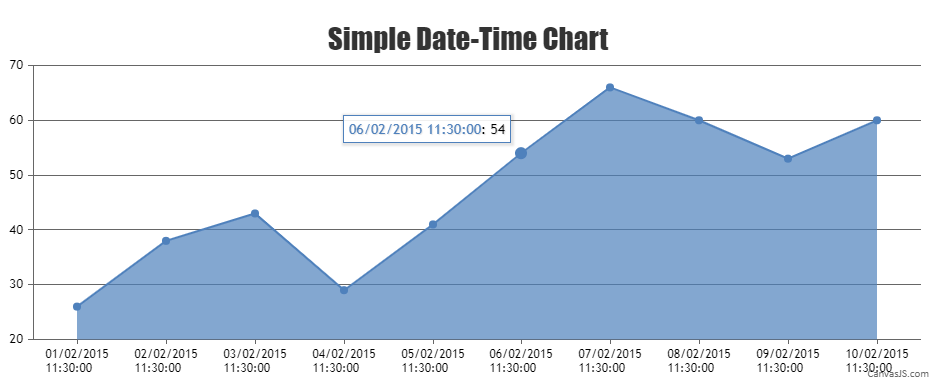
You can use formatDate() inside contentFormatter to format the date displayed in toolTip as shown in code snippet below –
toolTip: {
  contentFormatter: function (e) {
    var content = " ";
    for (var i = 0; i < e.entries.length; i++) {
      content += "<span style='color:" + e.chart.selectedColorSet[i] + ";'>" + CanvasJS.formatDate(e.entries[i].dataPoint.label, "DD/MM/YYYY HH:mm:ss") + "</span>" + ": " + e.entries[i].dataPoint.y;
      content += "<br/>";
    }
    return content;
  }
},
Also, please take a look at this updated JSFiddle for an example on formatting date displayed inside the toolTip.
___________
Indranil Deo
Team CanvasJS