Login to Ask a Question or Reply
Home › Forums › Chart Support › Sync ToolTip problem when not the same X axis datapoints › Reply To: Sync ToolTip problem when not the same X axis datapoints
April 26, 2021 at 6:47 pm
#34120
Nicolas,
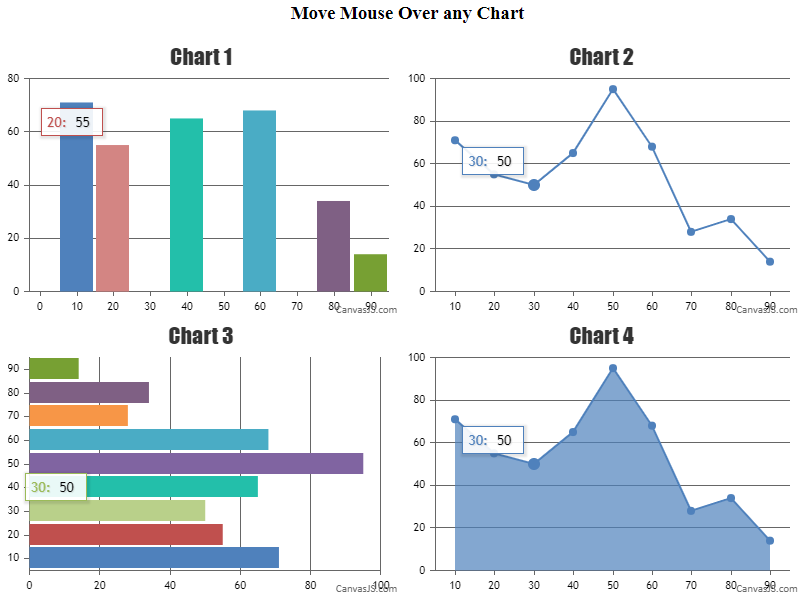
tooltip.showAt() shows the tooltip for specified x value passed as parameter not to nearest x value. In order to show tooltip to nearest x value, you can find the nearest x value and pass it in showAt method to display it. Please take a look at below code snippet for showing tooltip for nearest x value.
function getNearestXValues(xVal, dps1) {

	return [].concat(dps1).sort(function(a, b) {
    var diffA = Math.abs(xVal - a.x);
    var diffB = Math.abs(xVal - b.x);
    return diffA - diffB; // sort a before b when the distance is smaller
	})[0].x;

}

function showTooltip(e) {
  for( var i = 0; i < charts.length; i++){
    if(charts[i] != e.chart) {
    	charts[i].toolTip.showAtX(getNearestXValues(e.entries[0].xValue, charts[i].data[0].dataPoints));
    }

  }
}
Also, check out this JSFiddle for complete working code.

—-
Manoj Mohan
Team CanvasJS