Login to Ask a Question or Reply
Home › Forums › Chart Support › Tooltip multiline chart › Reply To: Tooltip multiline chart
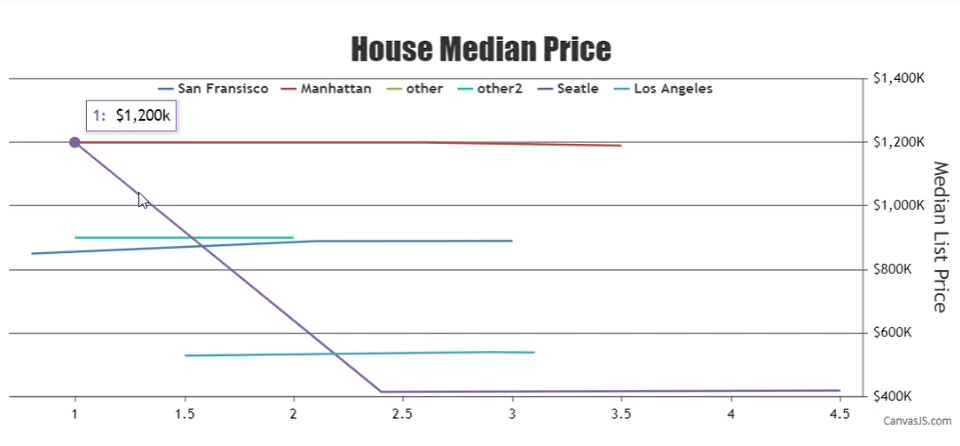
In case of line and area charts when you mouse hover on a specific series it gets highlighted. Hence, the toolTip is shown for the highlighted series based on the x-value of the nearest dataPoint to the mouse pointer position, even if, dataPoint of any other dataSeries are near to the cursor position. For example, if the series “Seatle” is highlighted then toolTip of the corresponding series would be shown based on the mouse pointer position to the nearest dataPoint. Please check the below screenshot for a reference –
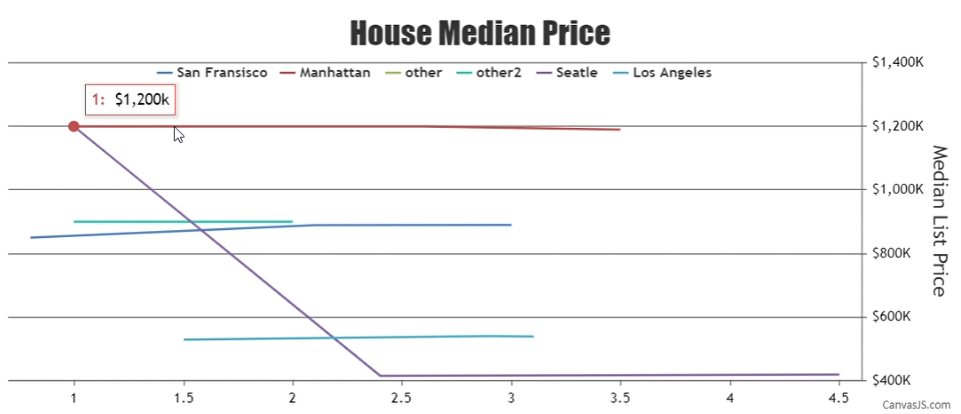
If the mouse pointer is shifted over a different series then the other series would be highlighted and toolTip for the other series would be shown. Please refer to the below screenshot for the same –
Based on the JSFiddle shared by you I would suggest you to use a shared toolTip.
___________
Indranil Deo
Team CanvasJS