Login to Ask a Question or Reply
Home › Forums › Chart Support › Charts with drop down button to filter › Reply To: Charts with drop down button to filter
March 27, 2020 at 4:10 pm
#28763
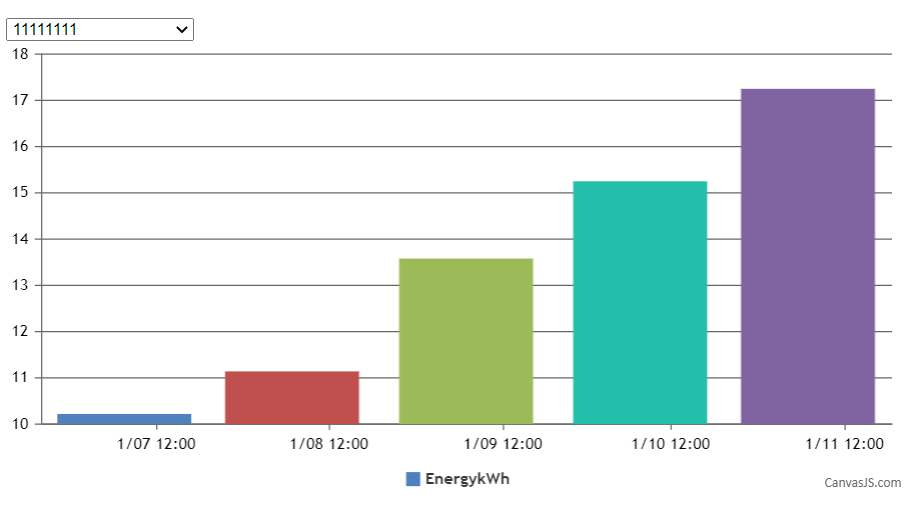
Chart animates only on the first/initial render, as of now. To animate at every subsequent selection, you can destroy and re-create the chart as shown in the code snippet below –
$( ".dropdown" ).change(function() {
  chart.destroy();
  chart = new CanvasJS.Chart("chartContainer",chartOptions);
  chart.options.data[0].dataPoints = [];
  selectDataSeries();
});

function selectDataSeries(){
  var selected = element.options[element.selectedIndex].value;
  dps = jsonData[selected];
  for(var i in dps) {
    var xVal = dps[i].x;
    chart.options.data[0].dataPoints.push({x: new Date(xVal), y: dps[i].y});
  }
  chart.render();
}
Please take a look at this JSFiddle for a working example.

___________
Indranil Deo
Team CanvasJS