Login to Ask a Question or Reply
Home › Forums › Chart Support › using drop down how to change charts using user input value › Reply To: using drop down how to change charts using user input value
There are couple of issue with the code that you have shared.
1. You need to replace chartType with chart in chartType.options.data[0].type as chartType is referred to dropdown field not the chart object.
chart.options.data[0].type = chartType.options[chartType.selectedIndex].value;
2. Below code has to be inside the window.onload function as chart is inside window.onload scope.
var chartType = document.getElementById("chartType");
        chartType.addEventListener( "change", function(){
        chart.options.data[0].type = chartType.options[chartType.selectedIndex].value;
        chart.render();
});
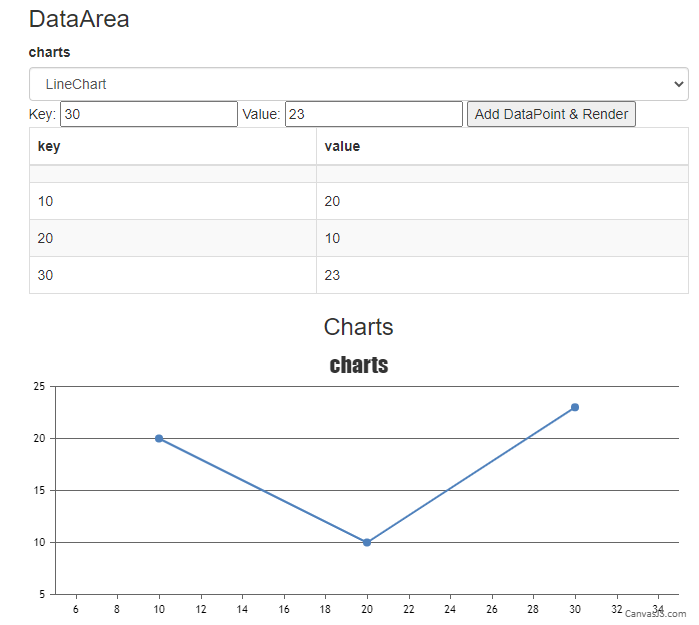
Please take a look at this JSFiddle for the complete code.

Considering this thread as a duplicate of using drop down how to change charts using user input value and hence closing the same.
—-
Manoj Mohan
Team CanvasJS