Login to Ask a Question or Reply
Home › Forums › Chart Support › can we get series minimum and maximum value of datapoints › Reply To: can we get series minimum and maximum value of datapoints
October 22, 2018 at 10:31 am
#23137
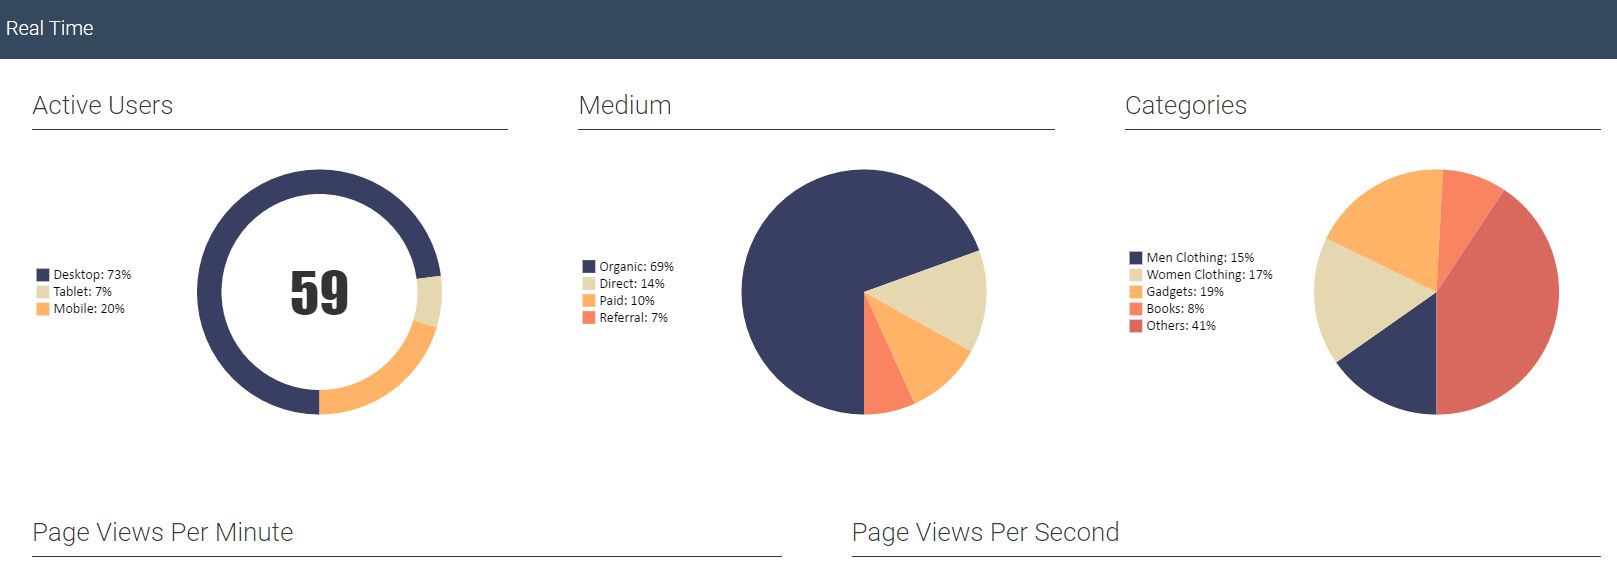
In update method, you are updating the last dataPoint’s y-value only and not x-value because of which x-value remains same and being shown in crosshair as such. Updating x and y-values should work fine in your case. To keep axis labels constant, please take a look at this sample dashboard. You can download the dashboards sample from our download page and try customizing and running locally.

—
Vishwas R
Team CanvasJS