Login to Ask a Question or Reply
Home › Forums › Chart Support › Tooltip formatting › Reply To: Tooltip formatting
March 12, 2018 at 11:51 am
#19893
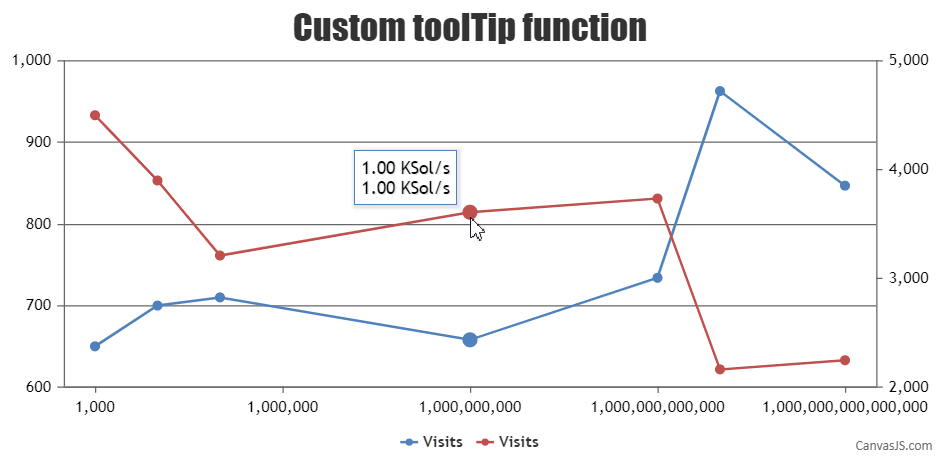
When shared property of toolTip is set to true it lists all the dataPoints of corresponding x-value for each dataSeries. You can loop through the entries to get all dataPoints of corresponding x-value in contentFormatter as shown in the code snippet below –
function contentFormatter(e){
  var content = " ";
  for (var i = 0; i < e.entries.length; i++) {
    var hashrate = e.entries[i].dataPoint.x;
    if (hashrate < 1000000) {
      content += (Math.round(hashrate / 1000) / 1000 ).toFixed(2)+' Sol/s';
      content += "<br/>";
    }
    else {
      var byteUnits = [ ' Sol/s', ' KSol/s', ' MSol/s', ' GSol/s', ' TSol/s', ' PSol/s' ];
      var j = Math.floor((Math.log(hashrate/1000) / Math.log(1000)) - 1);
      hashrate = (hashrate/1000) / Math.pow(1000, j + 1);
      content += hashrate.toFixed(2) + byteUnits[j];
      content += "<br/>";
    }
  }
  return content;
}
Also, please take a look at this JSFiddle for a working sample.
___________
Indranil Deo
Team CanvasJS