Login to Ask a Question or Reply
Home › Forums › Chart Support › Set image as a marker › Reply To: Set image as a marker
March 22, 2017 at 5:56 pm
#14645
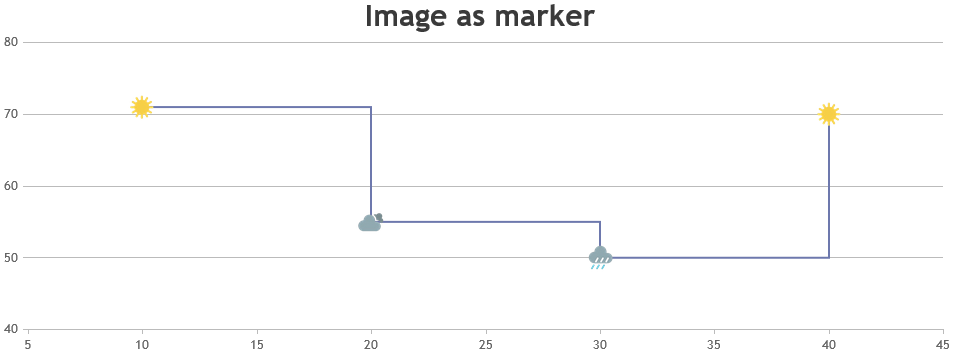
As of now markers can have only five possible values – “circle”, “square”, “triangle” , “cross” & “none”. However, you can position images in place of markers by adding few lines of code. Please checkout the code snippet below for the same.
addMarkerImages(chart);

function addMarkerImages(chart){
  for(var i = 0; i < chart.data[0].dataPoints.length; i++){
    customMarkers.push($("<img>").attr("src", chart.data[0].dataPoints[i].markerImageUrl)
                       .css("display", "none")
                       .css("height", 30)
                       .css("width", 30)
                       .appendTo($("#chartContainer>.canvasjs-chart-container"))
                      );
    positionMarkerImage(customMarkers[i], i);
  }
}

function positionMarkerImage(customMarker, index){
  var pixelX = chart.axisX[0].convertValueToPixel(chart.options.data[0].dataPoints[index].x);
  var pixelY = chart.axisY[0].convertValueToPixel(chart.options.data[0].dataPoints[index].y);

  customMarker.css({"position": "absolute",
                    "display": "block",
                    "top": pixelY - customMarker.height()/2,
                    "left": pixelX - customMarker.width()/2
                   });
}
Also, please take a look at this JSFiddle for a complete code. For further insight, please refer this how to section for positioning images over chart.
—
Suyash Singh
Team CanvasJS