@celtas6655,
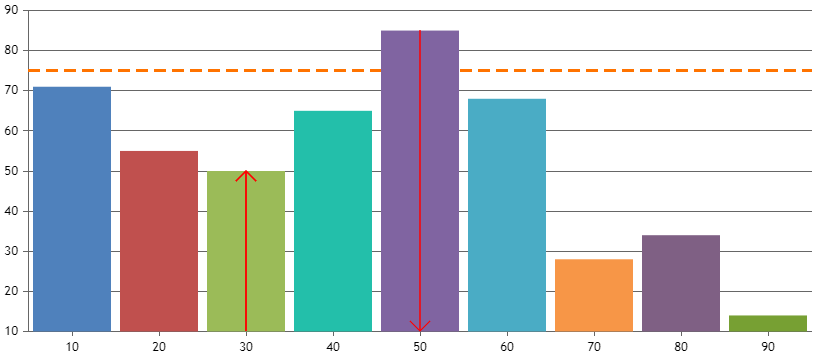
You can draw arrow on chart based on threshold by writing few lines of code. Please refer below code snippet for the same.
function renderArrow(chart) {
  for (var i = 0; i < chart.data[0].dataPoints.length; i++) {
    if (chart.data[0].dataPoints[i].enableArrow) {
      var axisBounds = chart.axisX[0].get("bounds");
      var x1, x2, y1, y2;
      var threshold = chart.axisY[0].stripLines[0].value;

      x1 = x2 = chart.axisX[0].convertValueToPixel(chart.data[0].dataPoints[i].x);
      y1 = axisBounds.y1;
      y2 = chart.axisY[0].convertValueToPixel(chart.data[0].dataPoints[i].y);

      chart.ctx.strokeStyle = "#FF0000";
      chart.ctx.moveTo(x1, y1);
      chart.ctx.lineTo(x2, y2);
      chart.ctx.stroke();

      if (chart.data[0].dataPoints[i].y < threshold) {
        chart.ctx.moveTo(x2, y2);
        chart.ctx.lineTo(x2 + 10, y2 + 10);
        chart.ctx.moveTo(x2, y2);
        chart.ctx.lineTo(x2 - 10, y2 + 10);
        chart.ctx.stroke();
      } else {
        chart.ctx.moveTo(x1, y1);
        chart.ctx.lineTo(x1 + 10, y1 - 10);
        chart.ctx.moveTo(x1, y1);
        chart.ctx.lineTo(x1 - 10, y1 - 10);
        chart.ctx.stroke();
      }
    }
  }
}
renderArrow(chart);
Also, please check out this JSFiddle for complete working example.

___________
Indranil Deo
Team CanvasJS