Steve,
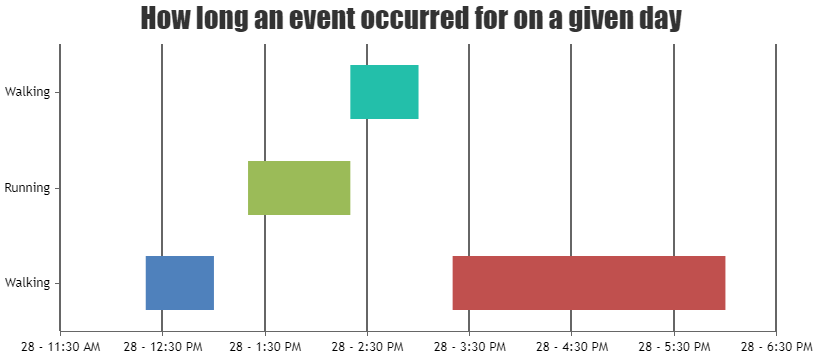
It is not possible to assign dateTime values as the y value in dataPoints, therefore it is not possible to create a Gantt Chart which contains dateTime values on the y-axis. But as a workaround, it is possible to use rangeBar chart and provide timestamp values as y-values and use CanvasJS.formatDate() in labelFormatter to convert the labels which is in timeStamp values into dateTime values. You can use the same logic in contentFormatter property as well to show the dateTime values in toolTip.
Please take a look at this code snippet below,
  axisY: {
    minimum: (new Date(2016, 0, 28, 12, 0)).getTime(),
    interval: (1 * 60 * 60 * 1000),
    labelFormatter: function(e){
      return CanvasJS.formatDate(e.value, "DD - h:mm TT");
    },
    gridThickness: 2
  },

  toolTip:{
    contentFormatter: function ( e ) {
      return "<strong>" + e.entries[0].dataPoint.label + "</strong></br> Start: " +  CanvasJS.formatDate(e.entries[0].dataPoint.y[0], "DD - h:mm TT") + "</br>End : " +  CanvasJS.formatDate(e.entries[0].dataPoint.y[1], "DD - h:mm TT");
    }}
Also, kindly take a look at this JSFiddle for the complete code as an example on creating a workaround Gantt Chart using CanvasJS.formatDate method.
—
Suyash Singh
Team CanvasJS
.