Login to Ask a Question or Reply
Forum Replies Created by Naveen Venugopal
-
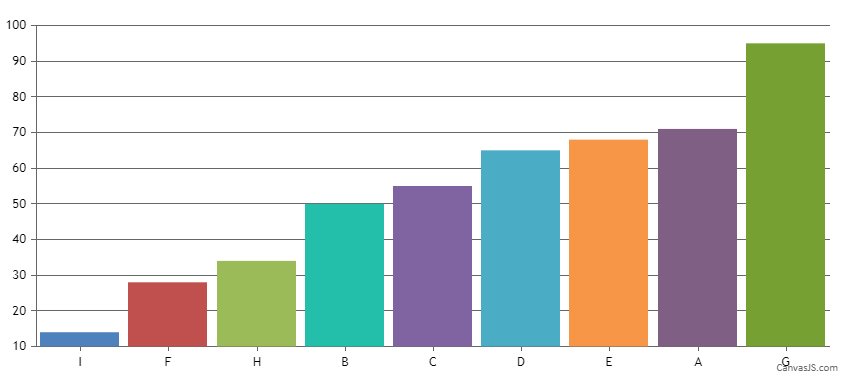
tufweb,
Sort feature is not available out of the box. However, with just a few lines of code, you can sort the dataPoint before rendering the chart. Please check out the code snippet below for the same.
function compareDataPointYAscend(dataPoint1, dataPoint2) {
		return dataPoint1.y - dataPoint2.y;
}

chart.options.data[0].dataPoints.sort(compareDataPointYAscend);
Also, please take a look at this JSFiddle for complete working code.
—-
Naveen Venugopal
Team CanvasJSAugust 31, 2015 at 2:54 pm in reply to: incorrect display canvasjs chart on jQuery multiple tab #9291Issue is because when you initially render the chart, Tab 2 and Tab 3 will have zero width and height because of which canvasjs takes default width and height. So what we need to do is, call chart.render() whenever a tabs becomes active there by updating the chart’s size.
Here is a JSFiddle.
xcorex,
The issue seems to be an additional line at the end of file which has not been handled in #6371. You can handle this case by checking if a line is empty as shown below.
for (var i = 0; i <= allLinesArray.length - 1; i++) {
	var rowData = allLinesArray[i].split(',');
	if(rowData && rowData.length > 1)
	  dataPoints.push({ label: rowData[0], y: parseInt(rowData[1]) });
}
I’ll also update #6371 with this code
—
Naveentomthomas,
You can make it multiline using indexLabelWrap & indexLabelMaxWidth properties. Here is an example.
—
NaveenHi,
We just looked into your code and found a minor issue. XMLHttpRequest is a asynchronous by default because of which data is not available when prepare() method is called.
You can fix the issue by making XMLHttpRequest synchronous as shown below.
rawFile.open("GET", "s.csv", false);Alternate way using Asynchronous XMLHttpRequest
Though the previous solution would work, it is generally not a good idea to use synchronous requests. Below is another example where we use async request. I’ve basically modified your code to call prepare data inside a call back function and it works fine.var xx = []; var yy = []; var data = []; var dataDiv = null; function readTextFile(callback) { var allText; var rawFile = new XMLHttpRequest(); rawFile.open("GET", "s.csv", true); rawFile.onreadystatechange = function () { if(rawFile.readyState === 4) { if(rawFile.status === 200 || rawFile.status == 0) { allText = rawFile.responseText; allText = allText.replace(/(?:\r\n|\r|\n)/g, ';'); allText = allText.split(';'); var iS = 0; var jS = 0; for (i = 0; i < allText.length; i++) { if(i%2 == 0) { xx[iS] = Number(allText[i]); iS++; } else { yy[jS] = Number(allText[i]); jS++; } } } callback(); } }; rawFile.send(null); } function prepare() { var limit = 10; //var y = 0; var dataSeries = { type: "line" }; var dataPoints = []; for (var i = 0; i <= limit; i++) { dataPoints.push({ x: xx[i], y: yy[i] }); } dataSeries.dataPoints = dataPoints; data.push(dataSeries); } function plotChart() { if(!dataDiv) { dataDiv = document.getElementById('myDiv'); var chart = new CanvasJS.Chart("chartContainer", { zoomEnabled: true, animationEnabled: true, title:{ text: "test" }, axisX :{ labelAngle: -30 }, axisY :{ includeZero:true }, data: data }); } readTextFile(function(){ dataDiv.innerHTML = yy[0]-yy[1]; data.length = 0; prepare(); chart.render(); }); }