Login to Ask a Question or Reply
Forum Replies Created by Ananya
-
March 5, 2026 at 4:40 pm in reply to: Marker Shown for first series whereas chart shows second series. #61984
@arj,
You can bind mouse events to the chart container, and show the toolTip at the datapoint nearest to the current x-coordinate, by using the toolTip showAtX method. Please take a look at this JSFiddle for an example of the same.
If this is not what you are looking for, could you please brief us more about your usecase, so that we can understand it better and help you out?
—
Ananya Deka
Team CanvasJSFebruary 27, 2026 at 5:06 pm in reply to: Marker Shown for first series whereas chart shows second series. #61970Krishna Nair,
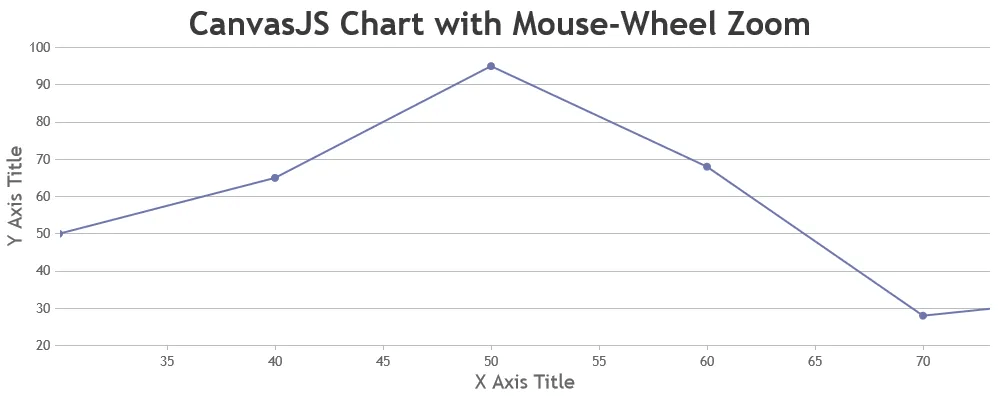
Mouse wheel zooming is not available as a built-in feature at the moment. However, you can achieve the same functionality with a few lines of code. Please refer to this article, which provides a reusable method that can be applied to any chart.
You can also take a look at this JSFiddle for a working example.
—
Ananya Deka
Team CanvasJSLaurent,
Please take a look at this JSFiddle for a sample implementation of your use case. The chart is re-rendered every time a tab is clicked, such that the chart dimensions are adjusted accordingly.
If your issue still persists, can you please share a JSFiddle reproducing your issue, so that we can understand the scenario better, and help you out?
—
Ananya Deka
Team CanvasJSLaurent,
CanvasJS Chart automatically sets the height and width of the chart according to container’s dimensions. If the values are not set for the container, it takes the default values. If you are using Bootstrap tabs, the issue may be that since the second tab is not displayed initially, the chart takes the default values. To solve this issue, second chart should be re-rendered when the shown.bs.tab event is fired by bootstrap.
You can also refer to this article to read up more about how to fix the issue.
—
Ananya Deka
Team CanvasJSDecember 30, 2025 at 3:36 pm in reply to: How can we achieve horizontal box and whisker chart? #61769We don’t support horizontal Box and Whisker charts as of now. However, as a workaround, you can rotate the chart using CSS to achieve a similar effect. Please take a look at this JSFiddle for an example of the same.
—
Ananya Deka
Team CanvasJSDecember 23, 2025 at 12:46 pm in reply to: Inconsistent Bar Width Makes Columns Overlaps for Stacked Column Chart Type. #61765@arj,
Datapoint width depends on multiple factors including range of x-axis, number of dataseries, sequence of datapoint values, etc. You can use dataPointWidth property to enforce the same column width across the series.
—
Ananya Deka
Team CanvasJSGlad that you figured out the solution and were able to make it work.
—
Ananya Deka
Team CanvasJSCould you please share the image again, as the link shared seems to be broken?
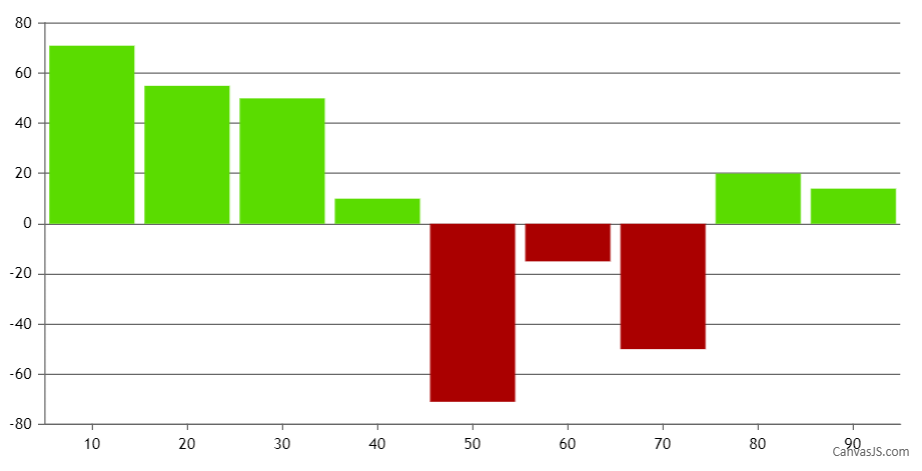
Also, the color is different for the columns rising up vs those dropping down.
You can change the color of column using color property of dataPoint as shown in the code snippet below –
function setColor(chart){
	for(var i = 0; i < chart.options.data.length; i++) {
  	dataSeries = chart.options.data[i];
  	for(var j = 0; j < dataSeries.dataPoints.length; j++){
    	if(dataSeries.dataPoints[j].y <= 0)
      	dataSeries.dataPoints[j].color = 'rgb(170, 0, 0)';
    }
  }
}
Also, please take a look at this JSFiddle which shows setting different colors to positive and negative values.
—
Ananya Deka
Team CanvasJSEquating
hoveredSeries === e.entries[i].dataSeries.indexshould work for you, even in the case of missing datapoints. Please take a look at this updated JSFiddle for the complete code.—
Ananya Deka
Team CanvasJSYou can use the mouseover event of the dataseries to detect which series is being hovered over, and use toolTip contentFormatter to style it accordingly.
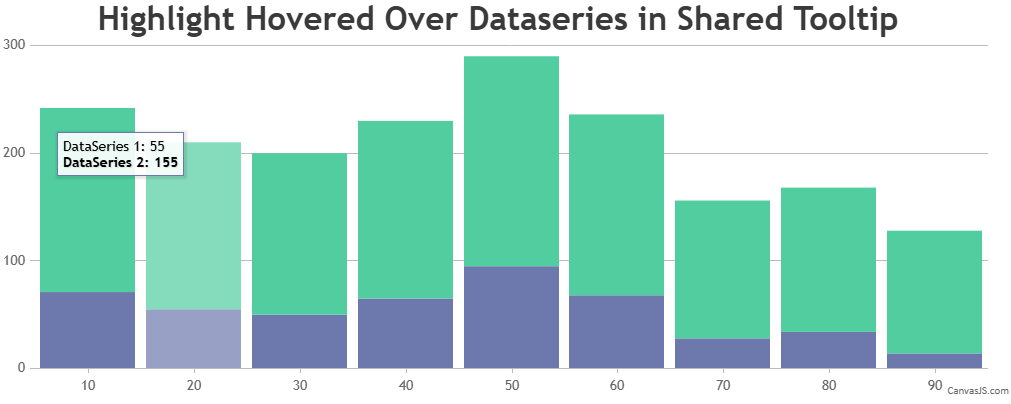
Please take a look at this JSFiddle for a working example of the same.
—
Team CanvasJS
Ananya DekaIt’s not possible to have unequal intervals for axis labels. As a workaround, you can dynamically add striplines at the first Y-value of each series by iterating through
chart.options.data. Please take look at this JSFiddle for an example of the same.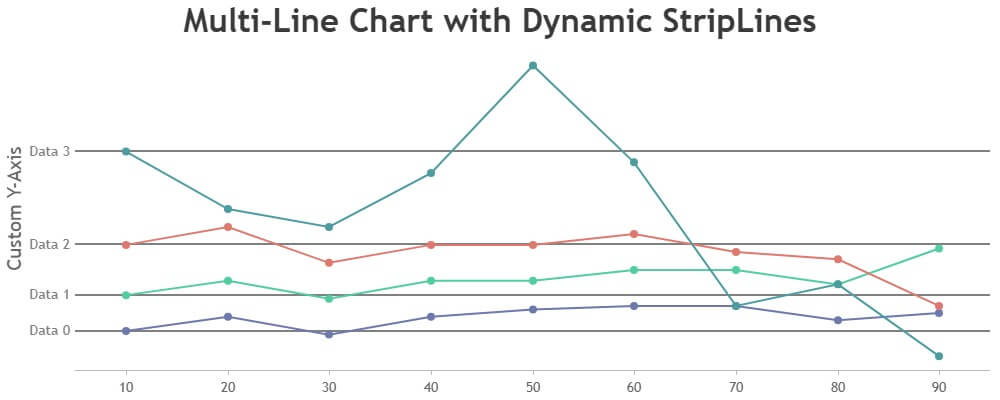
—
Ananya Deka
Team CanvasJS