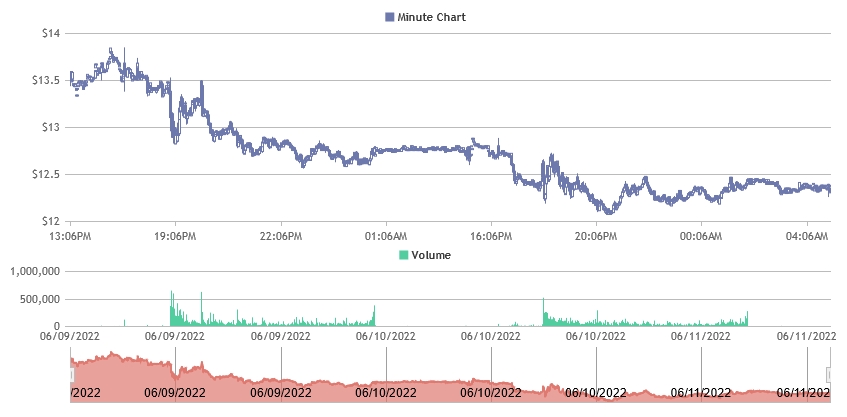
Hello, I’m trying to create intraday stock charts that only plot during hours when the market is open. To do this, I followed the instructions here: https://canvasjs.com/forums/topic/stockchart-empty-days/
However, I’m having issues with the X-axis label. Ideally, I’d like the top chart to show the time (for example 9:30AM), the second chart to show the date only (for example 06/10/2022), and the navigator to show the date only.
When I use the labelFormatter technique, it doesn’t pass along the date object so I’m not sure what to do at this point.
Here is the JSFiddle: https://jsfiddle.net/ct101/qujzcnxL/22/
Thanks
.