Home Forums Chart Support X-axis labels should always start at 1st of a month

X-axis labels should always start at 1st of a month

Viewing 2 posts - 1 through 2 (of 2 total)
  • #39428

    Hi CanvasJS Team,

    Below is an example of jsfiddle example.
    When the chart area is too small the x-axis ticks are calculated automatically and hence sometimes the 1st tick displayed can be Oct 3rd or Oct 1st based on the chart area. But I always want the chart to start at 1st of the month no matter what and the interval type should be day. The max data that is fed to the chart is a month long.

    Thanks,
    Neha Mahajan

    #39437

    Neha,

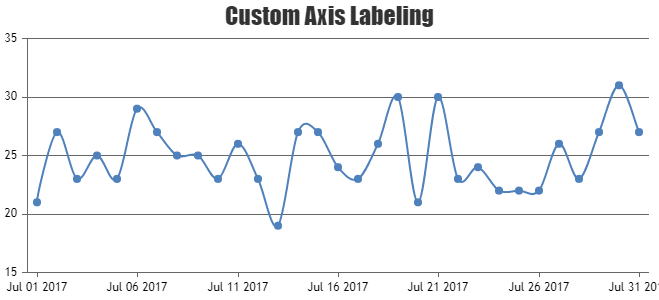
    Controlling the tick and label start point is not possible as of now. However, with the help of stripline, you can display the labels and ticks at custom intervals as shown in this JSFiddle.

    Custom Axis Labeling Chart

    —-
    Manoj Mohan
    Team CanvasJS

Viewing 2 posts - 1 through 2 (of 2 total)

You must be logged in to reply to this topic.