Home Forums Chart Support When the magnitude between values are too high not all the columns appear

When the magnitude between values are too high not all the columns appear

Viewing 3 posts - 1 through 3 (of 3 total)
  • #35918

    I have a column chart with 2 items in each group. If the magnitude between the items is too high, only 1 column will appear. The other item which have low value is not visible. How can I make it so that all the items appear?

    Here is an example: https://jsfiddle.net/canvasjs/QwZuf/

    #35938

    The example link is wrong. Here is the correct one https://jsfiddle.net/cohukfqa/

    #35945

    @zlwestwood,

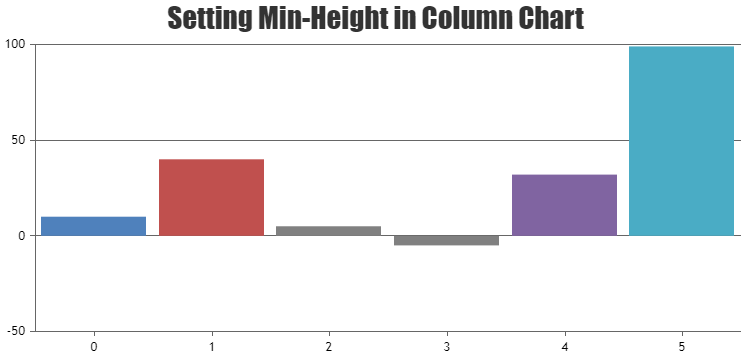
    Sorry, It is not possible to set minimum height of the column. However you can set minimum height to the columns with few lines of code as shown in the below code snippet

    function setMinValue() {
      var data = chart.options.data;
      for(var i = 0; i < data.length; i++) {
        for(var j =0; j < data[i].dataPoints.length; j++) {
        var yValue = data[i].dataPoints[j].y;
          if(yValue <= minValue && yValue >= -minValue) {
            data[i].dataPoints[j].color = "gray";
            data[i].dataPoints[j].y = yValue < 0 ? -minValue : minValue;
            data[i].dataPoints[j].toolTipContent = ("{x}: " + yValue);
          }
        }
      }
    }

    Also take a look at this JSFiddle for complete code.

    set


    Ranjitha R
    Team CanvasJS

    • This reply was modified 2 years, 6 months ago by Ranjitha R.
Viewing 3 posts - 1 through 3 (of 3 total)

You must be logged in to reply to this topic.