Login to Ask a Question or Reply
You must be logged in to post your query.
Home › Forums › Chart Support › What if, all y : data is 0 ?
What if, all y : data is 0 ?
- This topic has 9 replies, 2 voices, and was last updated 8 years, 7 months ago by
Sanjoy.
Tagged: 0 value in datapoint, dataPoints, pie chart
-
December 7, 2017 at 3:42 pm #17881
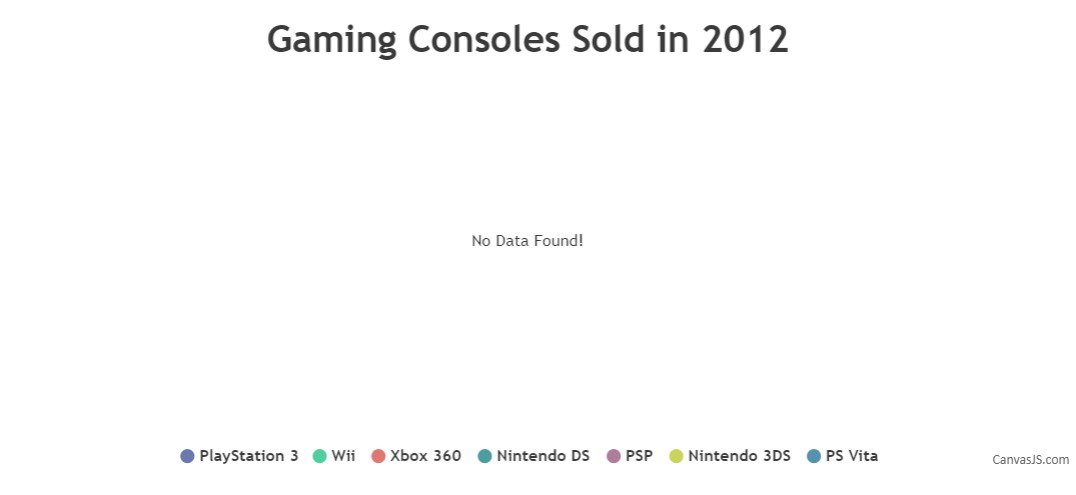
If i input 0 for all value of y: in datapoint pie-chart, chart doesn’t show-up/render.
Is it possible to display a message like : “No Data found!” for a particular canvas chart.
December 7, 2017 at 3:43 pm #17882Example :
<script type=”text/javascript”>
window.onload = function () {
var chart = new CanvasJS.Chart(“chartContainer”,
{
theme: “theme2”,
title:{
text: “Gaming Consoles Sold in 2012”
},
data: [
{
type: “pie”,
showInLegend: true,
toolTipContent: “{y} – #percent %”,
yValueFormatString: “#,##0,,.## Million”,
legendText: “{indexLabel}”,
dataPoints: [
{ y: 0, indexLabel: “PlayStation 3” },
{ y: 0, indexLabel: “Wii” },
{ y: 0, indexLabel: “Xbox 360” },
{ y: 0, indexLabel: “Nintendo DS”},
{ y: 0, indexLabel: “PSP” },
{ y: 0, indexLabel: “Nintendo 3DS”},
{ y: 0, indexLabel: “PS Vita”}
]
}
]
});
chart.render();
}
</script>December 8, 2017 at 11:11 am #17889In cases like above in which all the dataPoints have y-values as 0 or null, you can add subtitles to the chart with a message like “No Data Found!” as shown below:
showDefaultText(chart, "No Data Found!");

function showDefaultText(chart, text){
  var dataPoints = chart.options.data[0].dataPoints;
  var isEmpty = !(dataPoints && dataPoints.length > 0);

  if(!isEmpty){
    for(var i = 0; i < dataPoints.length; i++){
      isEmpty = !dataPoints[i].y;
      if(!isEmpty)
        break;
    }
  }

  if(!chart.options.subtitles)
    chart.options.subtitles = [];
  if(isEmpty)
    chart.options.subtitles.push({
      text : text,
      verticalAlign : 'center',
    });
  else
    chart.options.subtitles = [];
}
Please take a look at this JSFiddle for a working example with sample code.
—
Sanjoy Debnath
Team CanvasJSDecember 8, 2017 at 11:42 am #17890January 3, 2018 at 1:06 pm #18583One more help in similar case,
We need to hide legends in this situation as well.—
nik.sol
January 3, 2018 at 1:26 pm #18584I did this to achieve my functionality..
function showDefaultText(chart, text){
	 var dataPoints = chart.options.data[0].dataPoints;
   var isEmpty = !(dataPoints && dataPoints.length > 0);

   if(!isEmpty){
   	for(var i = 0; i < dataPoints.length; i++){
      isEmpty = !dataPoints[i].y;
      dataPoints[i].indexLabel = '';
    	if(!isEmpty)
        break;
    }
   }

   if(!chart.options.subtitles)
   	chart.options.subtitles = [];
   if(isEmpty)
   	chart.options.subtitles.push({
     text : text,
     verticalAlign : 'center',
   });
   else
   	chart.options.subtitles = [];
 }
Let me know if there is better way of doing it.
—
nik.sol
January 3, 2018 at 3:09 pm #18586Did some more changes..
Using this :
if(isEmpty){
  <strong> for(var i = 0; i < dataPoints.length; i++){
      dataPoints[i].indexLabel = '';
   }</strong>
   chart.options.subtitles.push({
     text : text,
     verticalAlign : 'center',
   });
}
Instead of :
if(!isEmpty){
   	for(var i = 0; i < dataPoints.length; i++){
      isEmpty = !dataPoints[i].y;
     <del datetime="2018-01-03T09:35:27+00:00"> dataPoints[i].indexLabel = '';</del>
    	if(!isEmpty)
        break;
    }
   }
—
nik.sol
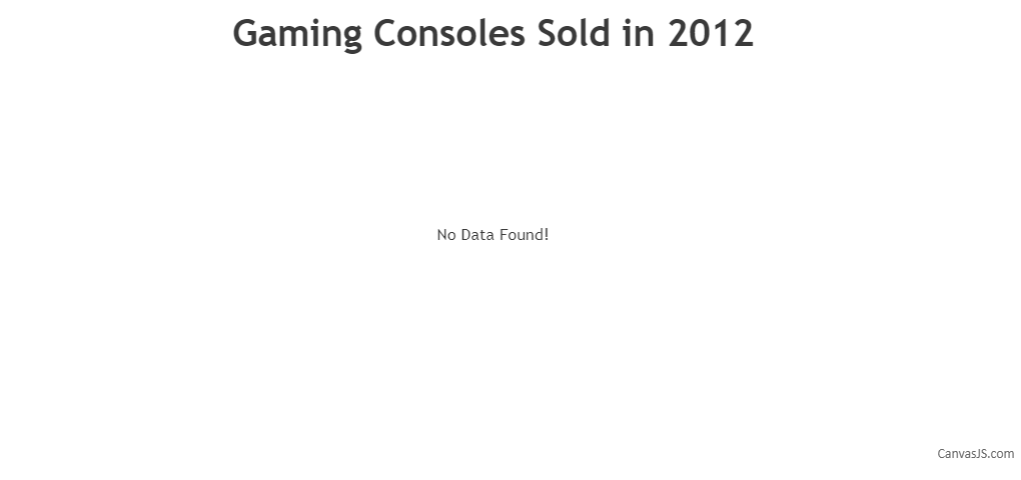
January 4, 2018 at 6:34 pm #18595One more help in similar case,
We need to hide legends in this situation as well.You can toggle showInLegend property if you are looking to hide legend for dataPoints with y-values as 0 or null as shown in the code snippet below:
showDefaultText(chart, "No Data Found!");

function showDefaultText(chart, text) {
  var dataPoints = chart.options.data[0].dataPoints;
  var isEmpty = !(dataPoints && dataPoints.length > 0);

  if (!isEmpty) {
    for (var i = 0; i < dataPoints.length; i++) {
      isEmpty = !dataPoints[i].y;
      if (!isEmpty)
        break;
    }
  }

  if (!chart.options.subtitles)
    chart.options.subtitles = [];
  if (isEmpty) {
    chart.options.subtitles.push({
      text: text,
      verticalAlign: 'center',
    });
    chart.options.data[0].showInLegend = false;
  } else {
    chart.options.subtitles = [];
    chart.options.data[0].showInLegend = true;
  }
}
Please take a look at this updated JSFiddle for a working example with sample code.
—
Sanjoy Debnath
Team CanvasJS
Tagged: 0 value in datapoint, dataPoints, pie chart
You must be logged in to reply to this topic.