Home Forums Chart Support want to display date with time when we hover over chart

want to display date with time when we hover over chart

Viewing 2 posts - 1 through 2 (of 2 total)
  • #36176

    Here is my code, everything works flawlessely.

    in x axis i am showing 100 items and so points are 1,2 ,3 … 100 i dont want to change x-axis to date and time but when customers hovers over chart that time i want to show the time so that they know when it happened exactly
    suppose customer hovers over x axis 5 then it shows 5:35.527 but i want to show 1Nov 2021:5:35PM i have time stamp so i should be able to do that
    on hover it should show
    here is jsfiddle
    https://jsfiddle.net/n46qkvtg/

    #36193

    @bydbest,

    It is possible to add some extra content (in your case timestamp) to the toolTip using contentFormatter property as shown in the code-snippet below,

    contentFormatter: function (e) {
          var content = " ";
          for (var i = 0; i < e.entries.length; i++) {
            content += CanvasJS.formatDate(e.entries[i].dataPoint.extraContent, "DD MMM YYYY: hh:mm TT") + " : " + "<strong>" + e.entries[i].dataPoint.y + "</strong>"
            content += "<br/>";
          }
      return content;
    }

    You will also need to pass the necessary timestamps as a custom property to the dataPoints array as shown in the code-snippet below,

    dataPoints: [
          { y: 35.427, extraContent: new Date(2021, 10, 01, 13, 35)},
          { y: 35.447, extraContent: new Date(2021, 10, 01, 14, 35)},
          { y: 35.467, extraContent: new Date(2021, 10, 01, 15, 35)},
          { y: 35.487, extraContent: new Date(2021, 10, 01, 16, 35)},
          ...
    ]

    Kindly take a look at this updated JSFiddle for an example on rendering a chart with additional content on the toolTip.
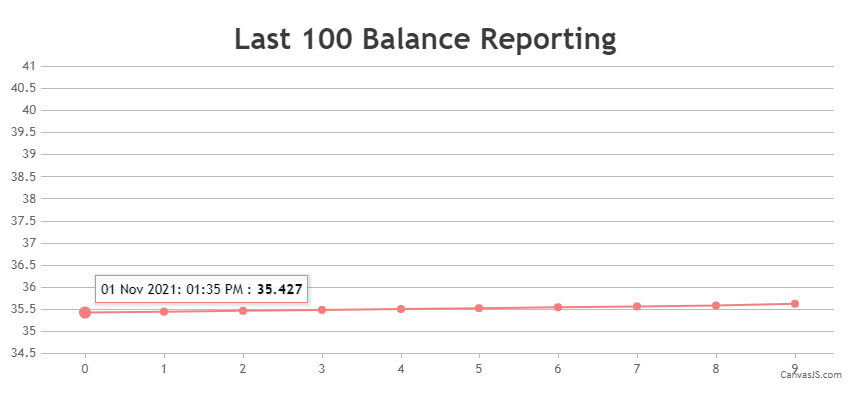
    Chart with additional dateTime toolTip content


    Adithya Menon
    Team CanvasJS

Viewing 2 posts - 1 through 2 (of 2 total)

You must be logged in to reply to this topic.