Login to Ask a Question or Reply
You must be logged in to post your query.
Home › Forums › Chart Support › using json array from php json_encode
using json array from php json_encode
- This topic has 9 replies, 2 voices, and was last updated 6 years, 5 months ago by
mrt4c.
-
January 24, 2020 at 1:47 pm #28156
Hi! Im new to canvasJS and my web programming isn’t very strong. I have a php file that retrieves data from a mysql database and encodes it into a json array. i would like to visualise this data into a graph using canvasjs but im not sure how to proceed. i would like the graph to update itself every 5 mins. i managed to achieve this using jQuery and a html table but im not sure how to do it using canvasJS.
Any help is greatly appreciated!
below is a snippet of my php code.$sql = 'SELECT * FROM sensor ORDER BY ID'; if($query = mysqli_query($conn,$sql)){ $json_array = array(); while($row = mysqli_fetch_array($query, MYSQLI_ASSOC)){ $json_array[] = $row; } echo json_encode($json_array);January 27, 2020 at 5:25 pm #28184Can you kindly create a sample project reproducing the issue along with the sample database and share it over Google-Drive or Onedrive so that we can look into the code, run it locally to understand the scenario better and help you resolve?
From what we have observed, sometimes things get delayed mostly when we are not able to reproduce the issue or not able to understand the exact requirements or the solution that we provide may not work properly due to the variation in chart-options being used by you and us.
Having a sample project helps us in figuring out the issue and suggesting an appropriate solution accordingly.
—
Shashi Ranjan
Team CanvasJSFebruary 4, 2020 at 2:56 pm #28277I just do not know how to start using CanvasJS. I have a json array but i do not know how to integrate it with canvasJS. A point in the right direction would be extremely helpful. I have looked at the examples on canvasJS but i still do not know how to proceed.
February 5, 2020 at 8:05 pm #28295When you have a JSON array it is very easy to generate charts from them. Let’s consider you have a JSON array in this format:
[
    [
      1483275269000,
      10
    ],
    [
      1483361668000,
      12
    ],
    [
      1483448068000,
      17
    ],
    [
      1483534467000,
      11
    ],
    [
      1483620867000,
      13
    ],
]
Now, you need to parse the data in the format accepted by CanvasJS to use them as dataPoints and generate a chart. Please refer to the code snippet below for an example:
[
  {
    x: new Date(1483275269000),
    y: 10
  },
  {
    x: new Date(1483275268000),
    y: 12
  },
  {
    x: new Date(1483448068000),
    y: 17
  },
  {
    x: new Date(1483534467000),
    y: 11
  }
]
You can also take a look at this gallery page for an example on creating a chart using JSON data in PHP.
—
Shashi Ranjan
Team CanvasJSFebruary 7, 2020 at 2:03 pm #28323Using https://canvasjs.com/php-charts/dynamic-live-multi-series-chart/ as reference, this is what i came up with:
This is my JSON array:
[{“ID”:6,”Date”:”2020-01-24 07:35:46″,”sensorName”:”sensor 1″,”sensorValue”:213},{“ID”:7,”Date”:”2020-01-24 07:35:46″,”sensorName”:”sensor 1″,”sensorValue”:433},{“ID”:8,”Date”:”2020-01-24 07:35:46″,”sensorName”:”sensor 2″,”sensorValue”:45},{“ID”:9,”Date”:”2020-01-24 07:35:46″,”sensorName”:”sensor 3″,”sensorValue”:54}]Im not sure how to retrieve data (Date, sensorName, sensorValue) from the JSON array.
For the graph, the x-axis will be the Date value from the JSON array. the y-axis will have values from the sensorValue. the graph should only show the latest 50 data points from the JSON array. the graph updates every 2 secs.February 7, 2020 at 2:05 pm #28324i cant seem to be able to upload my php codes. i keep getting blocked.
February 7, 2020 at 2:21 pm #28325I have placed all relevant files in this folder: folder
My objectives:
– plot only the latest 50 data points
– x axis will be Date value
– y axis will be sensor value
– update the graph every 5 seconds and only showing 50 data pointsFebruary 12, 2020 at 7:10 pm #28381Thank you for sharing the sample project.
– x axis will be Date value
– y axis will be sensor valueIn order to create a chart with date and time axis, you can parse the x-values are date objects and y-value as a number as shown below:
var sensor1 = <?php echo json_encode($json_sensor1, JSON_NUMERIC_CHECK); ?>;
var sensor2 = <?php echo json_encode($json_sensor2, JSON_NUMERIC_CHECK); ?>;
var dataPoints1 = [], dataPoints2 = [];
for(var i = 0; i < sensor1.length; i++){
	dataPoints1.push({ x: new Date(sensor1[i].Date), y: Number(sensor1[i].sensorValue)});
}
for(var i = 0; i < sensor2.length; i++){
	dataPoints2.push({ x: new Date(sensor2[i].Date), y: Number(sensor2[i].sensorValue)});
}
– plot only the latest 50 data points
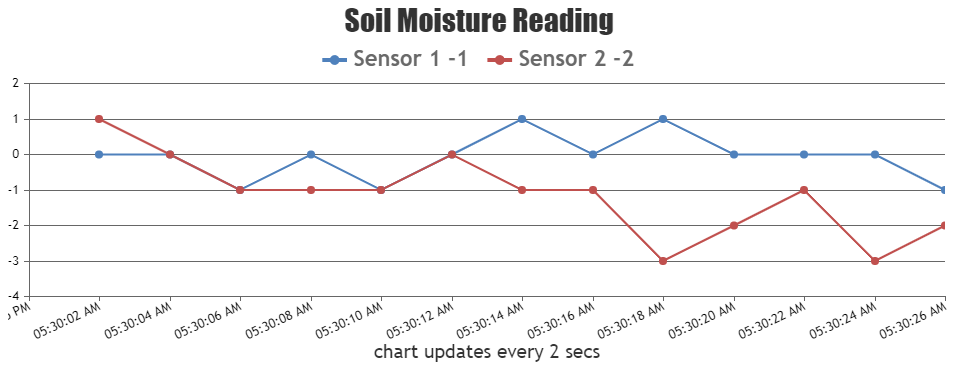
– update the graph every 5 seconds and only showing 50 data pointsIf you don’t want the dataPoints to keep getting accumulated, you can remove old values from the beginning of the Array before the chart is rendered. This process of getting new value from sensors and rendering the chart with those can be repeated every 5 seconds as shown below:
setInterval(function(){updateChart()}, updateInterval);

function updateChart() {
  xValue = dataPoints1[dataPoints1.length - 1].x.getTime();
  var deltaY1, deltaY2;
  xValue += updateInterval;
  // adding random value
  yValue1 += Math.round(2 + Math.random() *(-2-2));
  yValue2 += Math.round(2 + Math.random() *(-2-2));

  // pushing the new values
  dataPoints1.push({
    x: new Date(xValue),
    y: yValue1
  });
  sensor2.push({
    x: new Date(xValue),
    y: yValue2
  });

  if(dataPoints1.length > 50){
    dataPoints1.shift();
  }
  if(dataPoints2.length > 50){
    dataPoints2.shift();
  }
  // updating legend text with  updated with y Value
  chart.options.data[0].legendText = "Sensor 1 " + yValue1;
  chart.options.data[1].legendText = " Sensor 2 " + yValue2;
  chart.render();
}
Please take a look at this updated sample project for a working example with sample code.
—
Shashi Ranjan
Team CanvasJSFebruary 20, 2020 at 2:15 pm #28434@ShashiRanjan, thanks for your help! I will look through your sample code when my workload lightens. Thanks once again
You must be logged in to reply to this topic.