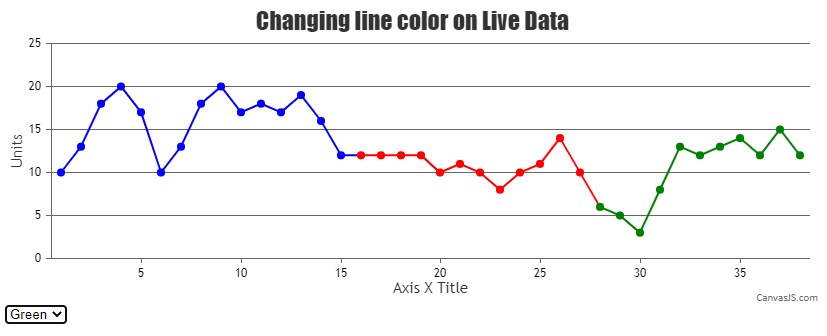
Hello, I have a use case where I’d like to have a dynamic line chart chart updating real time from an internal data source. I want to display the dynamic chart with several buttons below it, such that when the user clicks one of the buttons, the line chart will change color starting at the time that the button was clicked. It’s important the the prior data remain the ‘old’ color, and the new color only is shown after the button press. Note that the data source for the line remains the same.
I don’t see an obvious way that this is supported. Would appreciate any tips. Thanks very much.
.