@pragyasarkar,
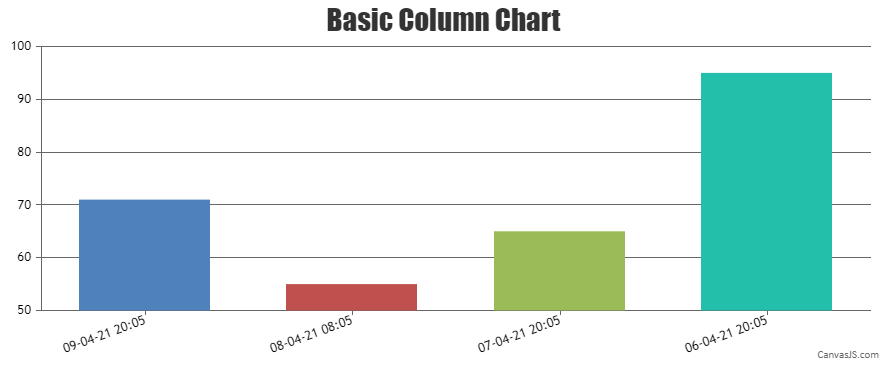
Labels are rendered at every interval on the axis and not to every dataPoint. However, if you like to show labels to dataPoint, you can use label property instead of x-value as shown in the code snippet below –
data: [{
  dataPoints: [
    { label: CanvasJS.formatDate(new Date('2021-04-09T20:05:25.000+05:30'), "DD-MM-YY HH:mm"), y: 71 },
    { label: CanvasJS.formatDate(new Date('2021-04-08T08:05:25.000+05:30'), "DD-MM-YY HH:mm"), y: 55 },
    { label: CanvasJS.formatDate(new Date('2021-04-07T20:05:25.000+05:30'), "DD-MM-YY HH:mm"), y: 65 },
    { label: CanvasJS.formatDate(new Date('2021-04-06T20:05:25.000+05:30'), "DD-MM-YY HH:mm"), y: 95 },
  ]
}]
Also, please take a look at this JSFiddle for complete working code.
___________
Indranil Deo
Team CanvasJS
.