Login to Ask a Question or Reply
You must be logged in to post your query.
Home › Forums › Chart Support › this._toolBar is undefined
this._toolBar is undefined
- This topic has 1 reply, 2 voices, and was last updated 8 years, 6 months ago by
Vishwas R.
Viewing 2 posts - 1 through 2 (of 2 total)
Tagged: Render error
-
January 24, 2018 at 10:54 pm #18937
I’m getting this pretty much straight out of the box.
Firefox 58 ( also happens with chrome Version 63.0.3239.132)
Linux ( debian )Display page.
  1 <!DOCTYPE html>
  2 <html>
  3     <head>
  4         <title>ChartJS - Line Graph</title>
  5         <style type="text/css">
  6             #chart-container {
  7                 width: 640px;
  8                 height: auto;
  9             }
 10         </style>
 11     </head>
 12     <body>
 13         <div id="chart-container">
 14             <canvas id="mycanvas"></canvas>
 15         </div>
 16         <p> something here please</p>
 17         <!-- javascript -->
 18         <script type="text/javascript" src="js/jquery.js"></script>
 19         <script type="text/javascript" src="https://cdn.canvasjs.com/canvasjs.min.js"></script>
 20         <script type="text/javascript" src="js/app.js"></script>
 21     </body>
 22 </html>
app.js
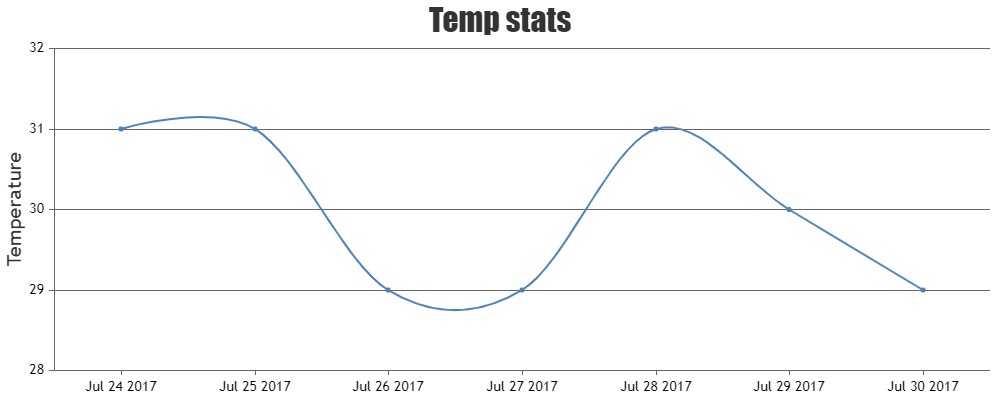
  1 $(document).ready(function(){
  2     $.ajax({
  3         url: "http://api.hexhome.int/chartData",
  4         method: "GET",
  5         dataType: 'json',
  6         success: function(data) {
  7             console.log(data);
  8
  9             var chart = new CanvasJS.Chart("chartContainer", {
 10                 animationEnabled: true,
 11
 12                 title:{
 13                     text: "Temp stats"
 14                 },
 15
 16                 axisY: {
 17                 title: "Temperature",
 18                 valueFormatString: "##.##"
 19                 },
 20
 21                 data: [{
 22                 type: "spline",
 23                 markerSize: 5,
 24                 xValueFormatString: "YYYY-MM-DD HH:mm:ss",
 25                 yValueFormatString: "##.##",
 26                 xValueType: "dateTime",
 27                 dataPoints: data
 28                 }]
 29             });
 30
 31             chart.render();
 32
 33         },
 34         error: function(data) {
 35             console.log(data);
 36         }
 37     });
 38 });
Data is returned from
 28 $app->get('/chartData', function ($request, $response, $args) {
 29     $listingMapper = new Controller($this->db);
 30     $dataPoints = $listingMapper->getMongoRoom();
 31     print (json_encode($dataPoints));
 32 });
Here is the full output from chrome
canvasjs.min.js:153 Uncaught TypeError: Cannot read property 'style' of undefined
    at q._updateOptions (canvasjs.min.js:153)
    at q._initialize (canvasjs.min.js:156)
    at q.render (canvasjs.min.js:164)
    at Object.success (app.js:48)
    at fire (jquery.js:3268)
    at Object.fireWith [as resolveWith] (jquery.js:3398)
    at done (jquery.js:9305)
    at XMLHttpRequest.<anonymous> (jquery.js:9548)
Thanks
January 25, 2018 at 10:51 am #18940There is some mismatch in the div-id being used (chart-container & chartContainer). Changing that should work fine in your case. Please take a look at this JSFiddle.
If you are still facing any issue, kindly create JSFiddle along with sample data, reproducing the issue so that we can look into it and help you out.
—
Vishwas R
Team CanvasJS
Viewing 2 posts - 1 through 2 (of 2 total)
Tagged: Render error
You must be logged in to reply to this topic.