@mustadirmahmood,
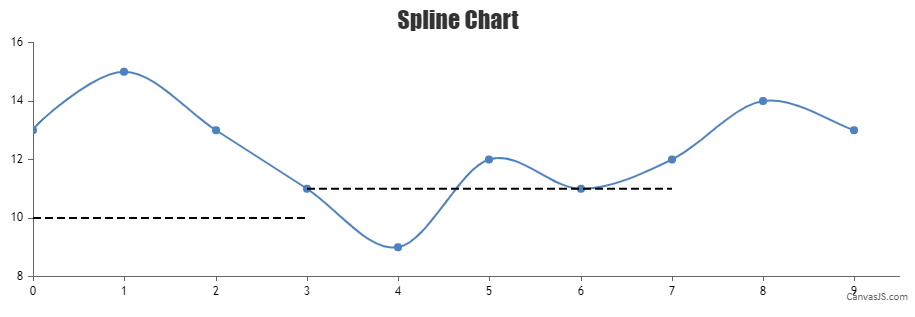
Strip Lines are used to highlight a certain region in the plot area across the full width/height of the chart and hence cannot have breakpoints. However, in your case, you can use a multi-series line chart with 2 dataPoints each to represent the start and end coordinates of the line.
Kindly take a look at this JSFiddle for a working example.
If the solution suggested doesn’t fulfill your requirement, kindly brief us further about your use case so that we can understand your scenario better and help you out with an appropriate solution.
—
Thangaraj Raman
Team CanvasJS
.