Home Forums Chart Support step area that is centered on data point

step area that is centered on data point

Viewing 2 posts - 1 through 2 (of 2 total)
  • #34079

    Hi. How can i make the step area chart to center on the tick/datapoint? Right now, the area is always on the right side of the datapoint. What i am trying to achieve is like a column chart but the data points are interconnected (no space between columns) so i tried to use the step area.

    #34122

    @lineseiki,

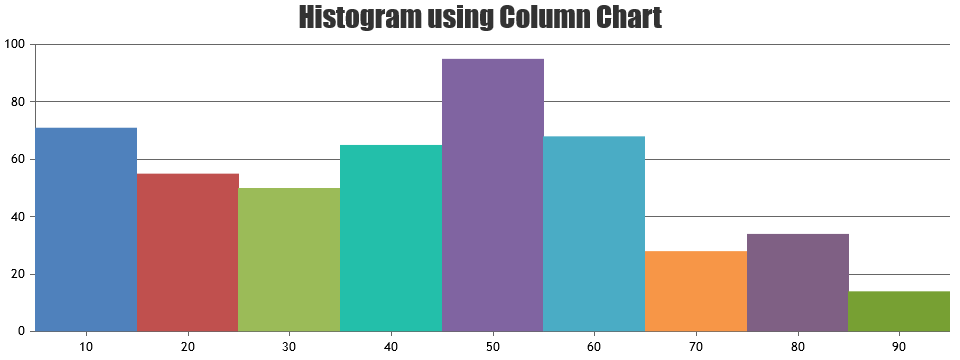
    In case of step-area chart, the step occurs at particular x-value that you pass. You can use column chart with no space between dataPoints – which you can achieve with the help of dataPointWidth property as shown in below code-snippet.

    chart.set("dataPointWidth",Math.ceil(chart.axisX[0].bounds.width/chart.data[0].dataPoints.length),true);
    
    $( window ).resize(function() {
    	chart.set("dataPointWidth",Math.ceil(chart.axisX[0].bounds.width/chart.data[0].dataPoints.length),true);
    });

    Please take a look at this JSFiddle for working example.
    Histogram Chart using Column Chart


    Vishwas R
    Team CanvasJS

Viewing 2 posts - 1 through 2 (of 2 total)

You must be logged in to reply to this topic.