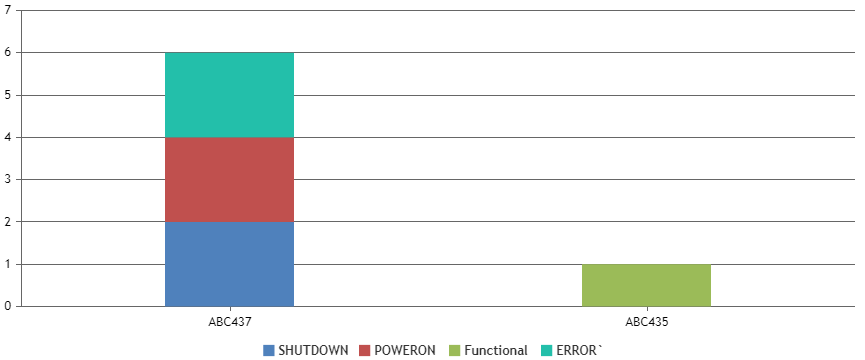
The datapoints below unable to show by each label, it only show last label ABC437 then stacked all Y in the same column.
data: [
{
type: “stackedColumn”,
showInLegend: true,
yValueFormatString: “# unit”,
name: “SHUTDOWN”,
dataPoints: [{“y”:2, ‘label’:”ABC437″}]
},
{
type: “stackedColumn”,
showInLegend: true,
yValueFormatString: “# unit”,
name: “POWERON”,
dataPoints: [{“y”:2, ‘label’:”ABC437″}]
},
{
type: “stackedColumn”,
showInLegend: true,
yValueFormatString: “# unit”,
name: “Functional”,
dataPoints: [{“y”:1, ‘label’:”ABC435″}]
},
{
type: “stackedColumn”,
showInLegend: true,
yValueFormatString: “# unit”,
name: “ERROR`”,
dataPoints: [{“y”:2, ‘label’:”ABC437″}]
},
]
});
chart.render();
.