Home Forums Chart Support Show Difference Between First Datapoint and Last Datapoint

Show Difference Between First Datapoint and Last Datapoint

Viewing 7 posts - 1 through 7 (of 7 total)
  • #32779

    Is there a way to dynamically show the difference between the first datapoint and the last datapoint on a line chart? Thanks.

    #32785

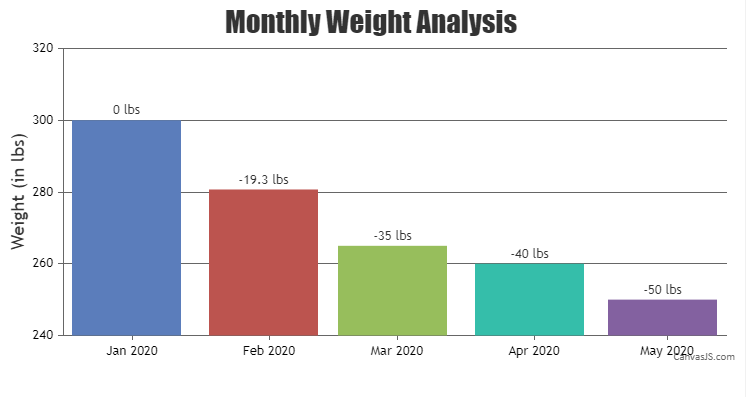
    For example, if we wanted to show weight loss, and there were three datapoints: 300; 280; and 265. Weight loss would be 20 on the second point and 35 on the third point. Is there a way to show that without hard coding it? Thanks.

    #32792

    @1CoolDude,

    You can achieve your requirements by showing the difference between dataPoints as indexLabel as shown in this JSFiddle.

    indexlabel to show change in value between datapoints in chart


    Adithya A Menon
    Team CanvasJS

    #32795

    Works great. Thanks.

    #32796

    I noticed that this works unless there are decimal places introduced. For example, 299.8 and 291.7. Then it returns 15 decimals places. Is there a way to have it return only on decimal place? Thanks.

    #32802

    @1CoolDude,

    You can format a number to fix decimals using formatNumber method. Please take a look at this JSFiddle for an example.


    Adithya A Menon
    Team CanvasJS

    #32806

    Very helpful. Thanks so much.

Viewing 7 posts - 1 through 7 (of 7 total)

You must be logged in to reply to this topic.