Home Forums Chart Support Show Data Label at the bottom

Show Data Label at the bottom

Viewing 2 posts - 1 through 2 (of 2 total)
  • #36893

    Hello. I am working on a multi series chart. And I am trying to get the label of a datapoints to show across the bottom of the chart. Say I am trying to get data from an XML and I have columns showing. Then I have weeks going across. I want to show the label of each week to show for each column. How can I go about doing that?

    #36906

    @bxpocalypse1,

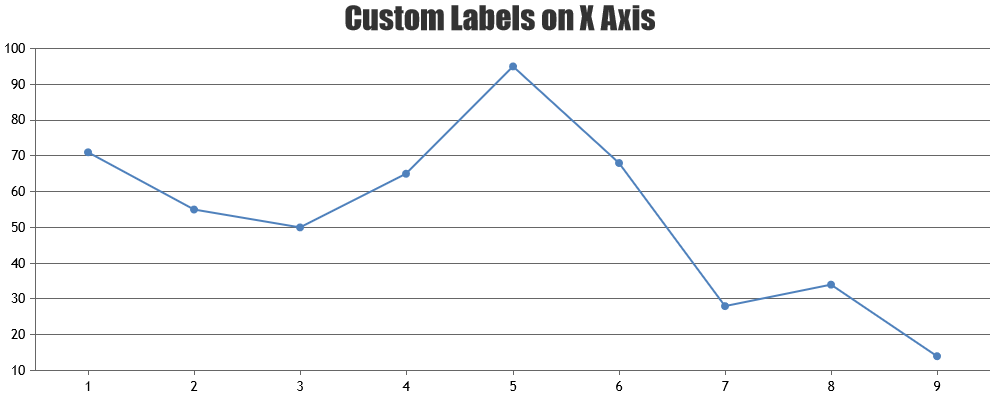
    You can take a look at this documentation page for a step-by-step guide on creating charts with data from XML. To show the label of each week for each column, you can use the label property.

    If the solution suggested doesn’t fulfill your requirement, kindly brief us further about your use case along with sample data so that we can understand your scenario better and help you out with an appropriate solution.

    Chart with custom X-axis labels


    Adithya Menon
    Team CanvasJS

Viewing 2 posts - 1 through 2 (of 2 total)

You must be logged in to reply to this topic.