Home Forums Chart Support Shading evening hours on time X axis

Shading evening hours on time X axis

Viewing 4 posts - 1 through 4 (of 4 total)
  • #38524

    I have a chart which uses a time/date X-axis scale, one division per hour. I would like to shade evening hours, i.e. x-values 19:00 – 07:00 to more easily identify days and nights in the data… kind of like interlaced colors but the background shading would change on X values instead of just every other data point interval. Is this possible?

    Fiddle:
    https://jsfiddle.net/dr34a19m/2/

    Example
    https://ibb.co/1ThhFxd
    Shade-evening-hours-on-chart

    #38539

    Just discovered that the fiddle I linked was bad. This one works: https://jsfiddle.net/cmayo/npu0hb6s/.

    #38547

    @cmayo,

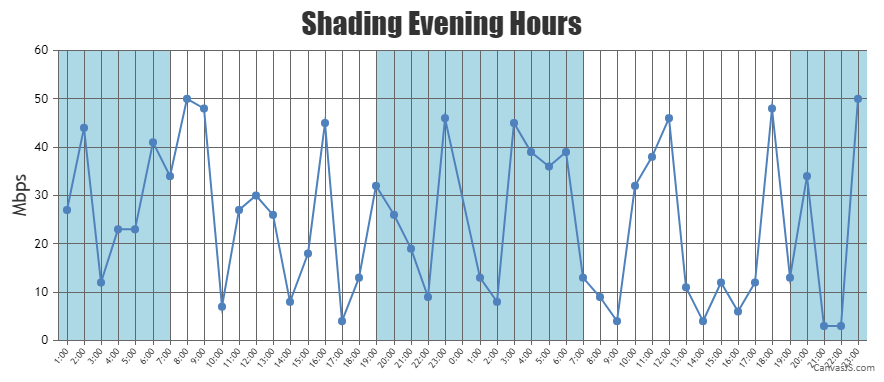
    You can use stripLines to shade the portion of the chart which displays evening data as shown in the code snippet below:

    stripLines: [
      {
        startValue: new Date(2012,1,1,0,0,0),
        endValue: new Date(2012,1,1,7,0,0),
        color: "lightblue"
      },
      {
        startValue: new Date(2012,1,1,19,0,0),
        endValue: new Date(2012,1,2,7,0,0),
        color: "lightblue"
      },
      {
        startValue: new Date(2012,1,2,19,0,0),
        endValue: new Date(2012,1,3,7,0,0),
        color: "lightblue"
      },
    ]

    Please take a look at this updated JSFiddle for a working example.

    Shading evening hours using striplines


    Thangaraj Raman
    Team CanvasJS

    #38699

    That’s perfect! Thank you so much!!

Viewing 4 posts - 1 through 4 (of 4 total)

You must be logged in to reply to this topic.