Home Forums Chart Support Scrollbar to chart canvas is increasing as tooltip height increases

Scrollbar to chart canvas is increasing as tooltip height increases

Viewing 3 posts - 1 through 3 (of 3 total)
  • #35663

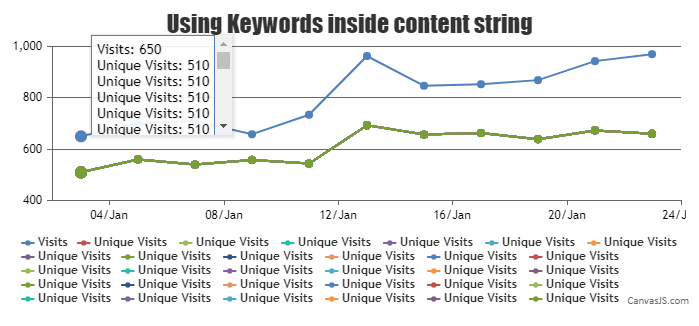
    I wanted to apply scrollbar to canvas of charts as legends count increases and I have given min-height, overflow for that and it is working. But as legends count increases tooltip height is increasing and canvas scrollbar is adjusting itself as per tooltip height. I want to show whole tooltip with canvas scrollbar.
    Here is a JSFiddle snippet of issue – https://jsfiddle.net/re5j8wzk/2/

    #35688

    @ishwari-birajdar,

    It is possible to use a scrollbar when there are multiple dataSeries needed to be shown on the toolTip. You can do so by changing overflow-y, height and pointer-events CSS properties of ‘canvasjs-chart-tooltip’ class as shown in the code-snippet below,

    .canvasjs-chart-tooltip{
      height: 100px !important;
      overflow-y: scroll !important;
      pointer-events: auto !important;
    } 

    Kindly take a look at this updated JSFiddle for an example on scrollable toolTip.

    Chart with scrollable toolTip


    Adithya Menon
    Team CanvasJS

    #35712

    Thank you Adithya

Viewing 3 posts - 1 through 3 (of 3 total)

You must be logged in to reply to this topic.