Home Forums Chart Support Rising and falling colour for ohlc

Rising and falling colour for ohlc

Viewing 3 posts - 1 through 3 (of 3 total)
  • #39421

    Currently you support the rising and falling colour attribute for candlestick.
    Does this work for OHLC and if not then it would be very useful to add this.

    #39422

    Please remove/close. I realised I could try it in your gallery and it is supported.
    Thank you

    #39435

    @thefireescaper,

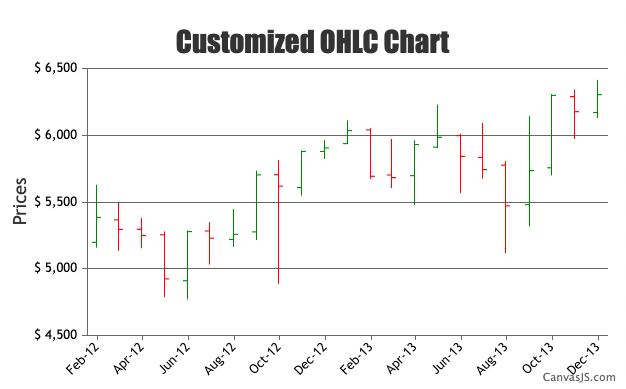
    You can set datapoint color based on the datapoint value, whether it’s rising or falling as shown in the code-snippet below.

    function changeBorderColor(chart){
      var dataSeries;
      for( var i = 0; i < chart.options.data.length; i++){
        dataSeries = chart.options.data[i];
        for(var j = 0; j < dataSeries.dataPoints.length; j++){
          dataSeries.dataPoints[j].color = (dataSeries.dataPoints[j].y[0] <= dataSeries.dataPoints[j].y[3]) ? ("green"? "green" : dataSeries.color) : ("red" ? "red" : dataSeries.color);
        }
      }
    }

    Please take a look at this JSFiddle for working example.

    customized ohlc chart

    Adithya Menon
    Team CanvasJS

Viewing 3 posts - 1 through 3 (of 3 total)

You must be logged in to reply to this topic.