Home Forums Chart Support Renko chart in Angular.

Renko chart in Angular.

Viewing 2 posts - 1 through 2 (of 2 total)
  • #33926

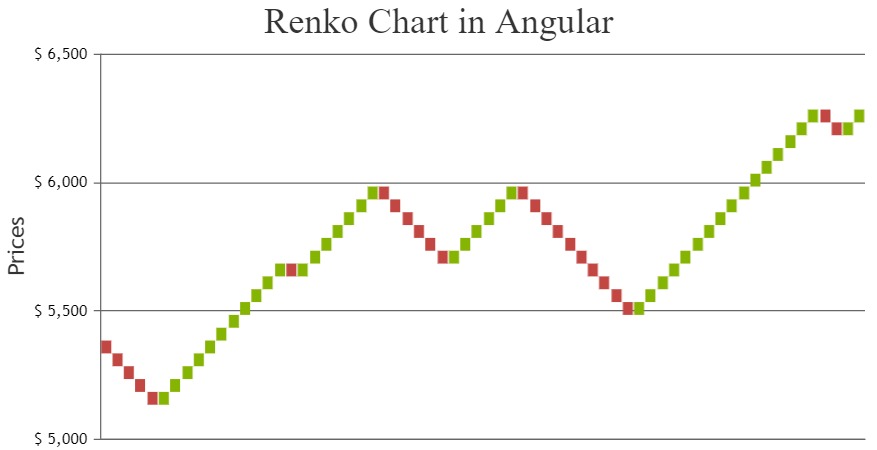
    I’m trying to implement renko chart in angular like this .
    But when I added data variable in my ts file I’m getting this error:

    
    Error: ./src/app/pages/stockdetails/stockdetails.component.ts 24:40
    Module parse failed: Invalid number (24:40)
    File was processed with these loaders:
     * ./node_modules/@angular-devkit/build-angular/src/babel/webpack-loader.js
     * ./node_modules/@ngtools/webpack/src/ivy/index.js
    You may need an additional loader to handle the result of these loaders.
    |                     { x: new Date(2012, 60, 10), y: [5283, 5348, 5032, 5229] },
    |                     { x: new Date(2012, 70, 10), y: [5220, 5448, 5164, 5258] },
    >                     { x: new Date(2012, 08, 10), y: [5276, 5735, 5215, 5703] },
    |                     { x: new Date(2012, 09, 10), y: [5704, 5815, 4888, 5619] },
    |                     { x: new Date(2012, 10, 10), y: [5609, 5885, 5548, 5879] },
    
    • This topic was modified 2 years, 12 months ago by azadcoder.
    #33939

    @azadcoder,

    You can define a function to perform the manipulation to create dataPoints for Renko chart and call the same function inside the class before rendering the chart as shown below –

    renderRenko(brickSize, data) {
        var newDataPoints = [];
        var oldValue = data[0].dataPoints[0].y[3];
        var difference = 0;
        var newValue, dataPoint, xValue;
        for (var i = 1; i < data[0].dataPoints.length; i++) {
          dataPoint = data[0].dataPoints[i].y[3];
          xValue = CanvasJS.formatDate(data[0].dataPoints[i].x, "MMM-YYYY");
          difference = dataPoint - oldValue;
          if(difference > 0 && difference > brickSize) {
            for(var j = 0; j < Math.floor(difference / brickSize); j++) {
              newValue = oldValue + brickSize;
              newDataPoints.push({content: xValue, y: [oldValue, newValue], color: "#86B402"});
              oldValue = newValue;
            }
          }
          else if(difference < 0 && Math.abs(difference) > brickSize) {
            for(var j = 0; j < Math.floor(Math.abs(difference) / brickSize); j++) {
              newValue = oldValue - brickSize;
              newDataPoints.push({content: xValue, y: [oldValue, newValue], color: "#C24642"});
              oldValue = newValue;	
            }
          }
        }
        var newData = [{
          type: "rangeColumn",
          toolTipContent: "<b>{content}</b> <br> {y[0]} - {y[1]}",
          dataPoints: newDataPoints
        }];
        return newData;
    }
    export class AppComponent  {
      ngOnInit() { 
       . 
       .
       .
       .
       chart.options.data = this.renderRenko(50, data);
       chart.render();
    }

    Please take a look at this StackBlitz for a working example.

    Renko chart in Angular

    ___________
    Indranil Deo
    Team CanvasJS

Viewing 2 posts - 1 through 2 (of 2 total)

You must be logged in to reply to this topic.