Home Forums StockChart Support React stockchart auto range changing on yaxis not working.not working

React stockchart auto range changing on yaxis not working.not working

Viewing 3 posts - 1 through 3 (of 3 total)
  • #34458

    I am using react to render canvasjs stockchart(line chart).When I use the dataset used in this example, yaxis works fine and changes its dataPoints according to current viewpoint’s minimum and maximum value. But whenever tried with another dataset(for ex. this, it just doesn’t work(chart renders perfectly but yaxis dataPoints won’t change corresponding to current range).

    #34473

    @vedant,

    Thanks for reporting the use-case. Based on testing it looks like a bug. We will fix it in our upcoming versions.

    ___________
    Indranil Deo
    Team CanvasJS

    #34605

    @vedant,

    Based on the data provided by you we observed that the x-values(dates) are not sorted. Hence, sorting the data in ascending order with respect to dates seems to be working fine. Please check the below code snippet to sort data in React –

    componentDidMount() {
        //Reference: https://reactjs.org/docs/faq-ajax.html#example-using-ajax-results-to-set-local-state
        fetch("https://financialmodelingprep.com/api/v3/historical-price-full/AAPL?apikey=demo")
          .then(res => res.json())
          .then(
            (data) => {
              var dps = [];
              var dataPoints = data.historical;
              for (var i = 0; i < dataPoints.length; i++) {
                dps.push({
                  x: new Date(dataPoints[i].date),
                  y: Number(dataPoints[i].close)
                });
              }
    
              //sorting dataPoints in ascending order with respect to x-values
              dps.sort(this.compareDataPointXAscend);
    
              this.setState({
                isLoaded: true,
                dataPoints: dps
              });
            }
         )
     }
    
     compareDataPointXAscend(dataPoint1, dataPoint2) {
         return dataPoint1.x.getTime() - dataPoint2.x.getTime();
     }

    Also, kindly take a look at this working sample project to sort the data with respect to dates in React. Please refer to the instructions.txt file for steps to deploy the sample.
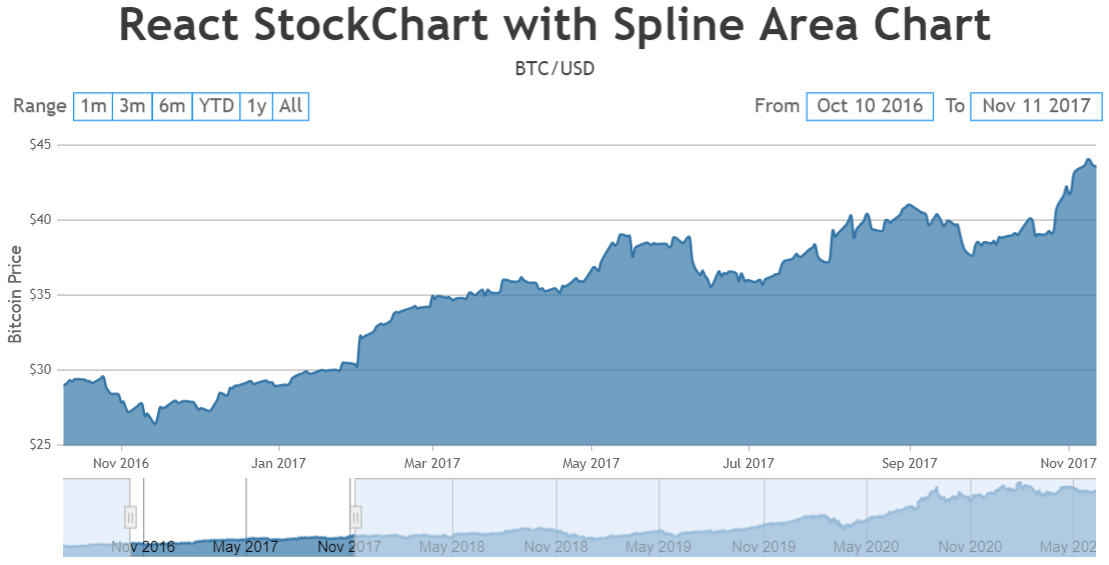
    Sorting data in React StockChart

    ___________
    Indranil Deo
    Team CanvasJS

Viewing 3 posts - 1 through 3 (of 3 total)

You must be logged in to reply to this topic.