Login to Ask a Question or Reply
You must be logged in to post your query.
Home › Forums › Chart Support › Push StripLine values using JSON in .Net Core Razor Page Application
Push StripLine values using JSON in .Net Core Razor Page Application
- This topic has 2 replies, 2 voices, and was last updated 4 years, 7 months ago by
tgriffiths.
Tagged: ajax json canvasjs .net-core
-
December 21, 2021 at 2:06 pm #36538
Hello.
I am developing a .NET Core 3.1 Razor Pages Application along with Canvasjs. I am attempting to create a Statistical Process Control Chart, and I am making decent progress.
I need to push the chart data using JSON, and so far I have managed to push the Data Points, but I also need to push values for Strip Lines, e.g. average, upper and lower limits of the y axis data.
I’ve uploaded a sample project to Google Docs which can be downloaded from https://drive.google.com/file/d/1Hcnmqlj2Ob4OlMdJ0OoDIwv0vTYBZzj5/view?usp=sharing
I’m asking for help with the following:
Push Strip Line Values
You’ll see from the code that I currently push the chart Data Points using an AJAX call and returning JSON data. However, I also need to return values for the 3 strip lines (average, upper and lower) which I have set manually within the demo project. These values are already calculated in the JSON function, however, I don’t know how to return them to the chart along with the Data Points.Dummy dataSeries for legends average, upper and lower
I have also added dummy data series to the chart to create legends for the average, upper and lower strip lines. I also need to be able to push values to each of these dataSeries, i.e. the name and data point.I’ve also noticed that when adding the dummy dataSeries that it squashes the chart values, can this be solved?
Any help with this is greatly appreciated.
Thank you.
December 21, 2021 at 7:53 pm #36548Push Strip Line Values
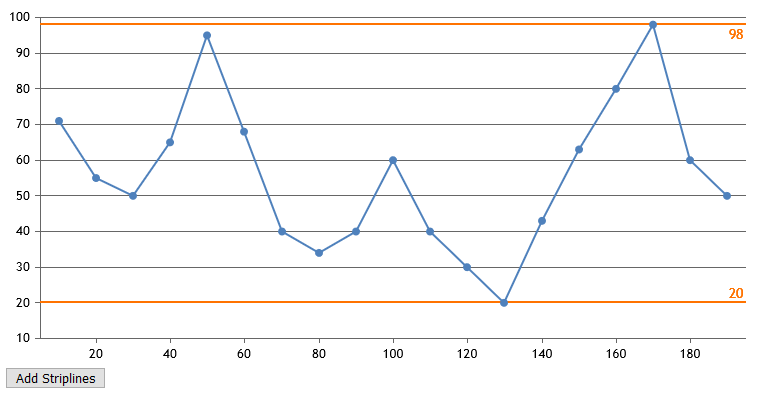
You’ll see from the code that I currently push the chart Data Points using an AJAX call and returning JSON data. However, I also need to return values for the 3 strip lines (average, upper and lower) which I have set manually within the demo project. These values are already calculated in the JSON function, however, I don’t know how to return them to the chart along with the Data Points.You can add striplines dynamically using addTo method to any desired value. Please refer the below code-snippet to add striplines at minimum & maximum values of dataSeries –
chart.axisY[0].addTo("stripLines", { value: minY, label: minY, thickness:2 }, false);
chart.axisY[0].addTo("stripLines", { value: maxY, label: maxY, thickness:2 });
Also, kindly take a look at this JSFiddle for complete code.
Dummy dataSeries for legends average, upper and lower
I have also added dummy data series to the chart to create legends for the average, upper and lower strip lines. I also need to be able to push values to each of these dataSeries, i.e. the name and data point.I’ve also noticed that when adding the dummy dataSeries that it squashes the chart values, can this be solved?
In your case, you have added dataPoints to the dummy dataSeries whose x-values are comparatively higher than that of the dataPoints present in the first dataSeries, as a result, it is reserving the space for those dataPoints. You can overcome this by dynamically adding the x-value of first dataPoint(from first dataSeries) to the dummy dataSeries by updating chart options as shown below –
chart.options.data[1].dataPoints.push({ x: new Date(chart.options.data[0].dataPoints[0].x), y: 0 });
chart.options.data[2].dataPoints.push({ x: new Date(chart.options.data[0].dataPoints[0].x), y: 0 });
chart.options.data[3].dataPoints.push({ x: new Date(chart.options.data[0].dataPoints[0].x), y: 0 });
chart.render();
Please check this JSFiddle for an example on adding dataPoints and name to dataSeries by updating chart options.
___________
Indranil Singh Deo
Team CanvasJSDecember 21, 2021 at 10:19 pm #36549Hi Indranil
This is awesome.
Thank you for your help.
Tony.
Tagged: ajax json canvasjs .net-core
You must be logged in to reply to this topic.