Home Forums StockChart Support Pragmatically get axisX.stripLines label

Pragmatically get axisX.stripLines label

Viewing 6 posts - 1 through 6 (of 6 total)
  • #32862

    I am using axisX.stripLines as a means to show different stock events (earnings, dividends, etc.) and would like to make the label interactive to allow a tooltip hover or pressing to show more details. To do this I would like to know how to get the offset so i could add such an event?

    #32875

    @ekaqu1028,

    Mouse events like click, mouseover, mouseout, etc. are not available on the stripline/axes labels as of now. Hence, it’s not possible to show toolTip on interaction with labels as of now.

    ___________
    Indranil Deo
    Team CanvasJS

    #32898

    I am fine without mouseover events, but was wondering if I can get the offset of the label so i can add my own div to simulate this?

    Another way of looking at it, is there a way to get the position of a single X axis point? If i know the X axis offset and the bottom of the chart, i can overlay my own thing.

    #32900

    Based off https://canvasjs.com/forums/topic/getting-x-y-of-data-point/ I think i figured out how

    chart.charts[0].axisX[0].convertValueToPixel(chart.charts[0].options.axisX.stripLines[44].value) // returns negative if outside of view, positive when in the view
    chart.charts[0].axisY[0].convertValueToPixel(0) // returns the bottom of the chart

    will play around with this to see how far i make it

    #32901

    hmmm, y axis is off… graphing NVDA over the past 3m shows the min value of 500, but

    document.getElementById(“chartContainer”).offsetTop + chart.charts[0].axisY[0].convertValueToPixel(510)

    returns 713.6666666666666, which puts the div element off screen. When I manually place it the value should be 225. I also tried subtracting the other charts (volume + MACD) but the result is still off screen…

    document.getElementById(“chartContainer”).offsetTop + chart.charts[0].axisY[0].convertValueToPixel(510) – chart.charts[1].height – chart.charts[2].height
    553.6666666666666

    any idea how to fix the y axis to point to the actual bottom of the chart?

    • This reply was modified 3 years, 1 month ago by ekaqu1028.
    • This reply was modified 3 years, 1 month ago by ekaqu1028.
    #32928

    @ekaqu1028,

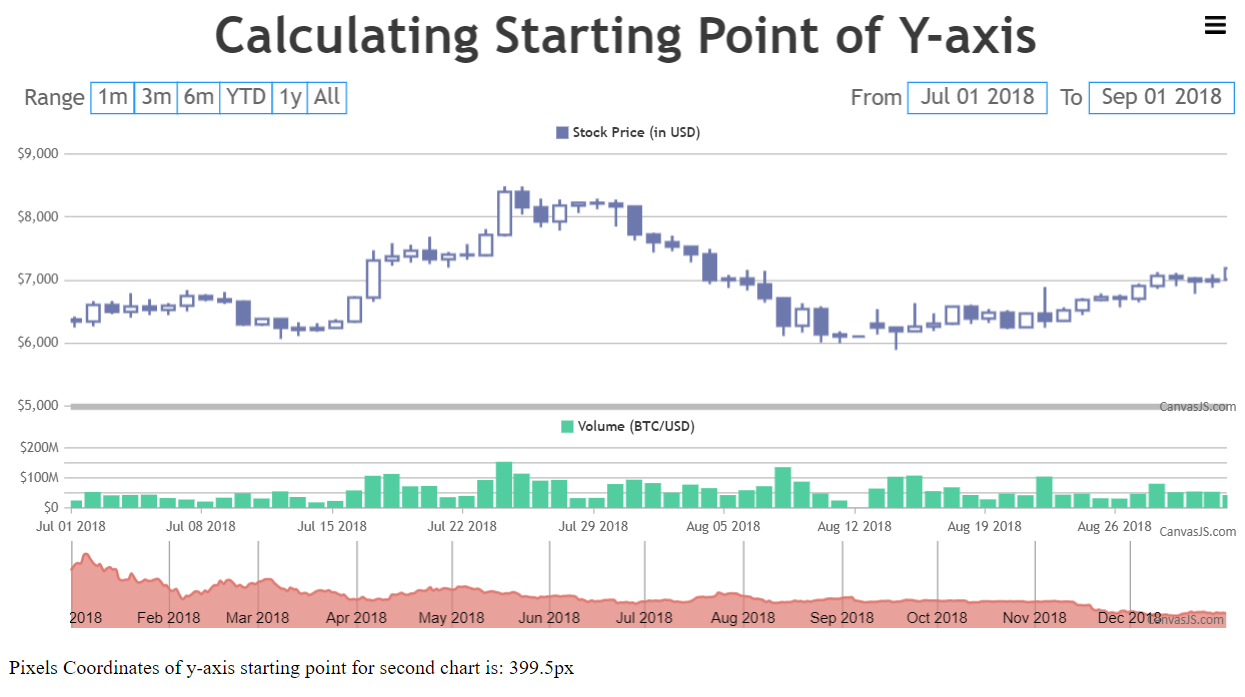
    In the code sample shared by you, the offsetTop value of chartContainer is added to the pixel coordinate of the axisY. The chartContainer contains the complete stockChart. Hence, to calculate the pixel coordinate of y-axis for a specific chart you need to add the offsetTop value of the chart with the pixel coordinate of the axisY as shown below –

    stockChart.charts[1].container.offsetTop + stockChart.charts[1].axisY[0].convertValueToPixel(stockChart.charts[1].axisY[0].viewportMinimum)

    Also, kindly take a look at this JSFiddle for an example on calculating the starting/bottom point of y-axis.

    calculating starting point of y-axis

    ___________
    Indranil Deo
    Team CanvasJS

Viewing 6 posts - 1 through 6 (of 6 total)

You must be logged in to reply to this topic.