Login to Ask a Question or Reply
You must be logged in to post your query.
Home › Forums › Chart Support › PLOT Graph using txt
PLOT Graph using txt
- This topic has 4 replies, 2 voices, and was last updated 3 years, 1 month ago by
Manoj Mohan.
Tagged: line graph Plot
-
April 27, 2021 at 6:10 pm #34135
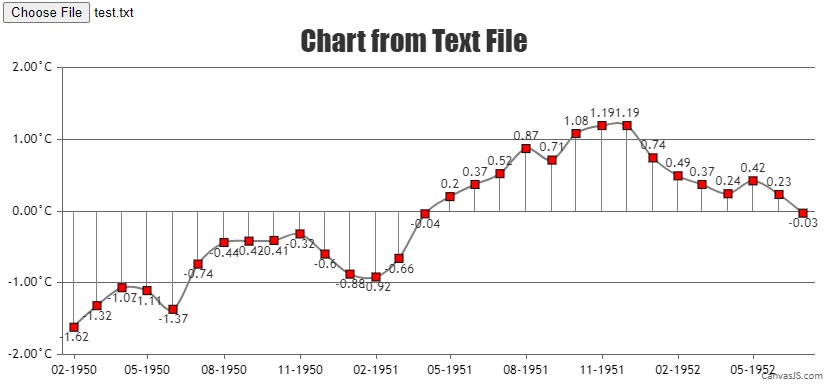
Hello I want to create a graph with txt source. The example in txt file is this
YR MON TOTAL ClimAdjust ANOM
1950 1 24.56 26.18 -1.62
1950 2 25.07 26.39 -1.32
1950 3 25.88 26.95 -1.07
1950 4 26.29 27.39 -1.11
1950 5 26.19 27.56 -1.37
1950 6 26.47 27.21 -0.74
1950 7 26.28 26.72 -0.44
1950 8 25.88 26.30 -0.42
1950 9 25.73 26.14 -0.41
1950 10 25.68 26.01 -0.32
1950 11 25.46 26.06 -0.60
1950 12 25.29 26.18 -0.88
1951 1 25.26 26.18 -0.92
1951 2 25.72 26.39 -0.66
1951 3 26.91 26.95 -0.04
1951 4 27.59 27.39 0.20
1951 5 27.93 27.56 0.37
1951 6 27.73 27.21 0.52
1951 7 27.59 26.72 0.87
1951 8 27.01 26.30 0.71
1951 9 27.22 26.14 1.08
1951 10 27.20 26.01 1.19
1951 11 27.25 26.06 1.19
1951 12 26.92 26.18 0.74
1952 1 26.67 26.18 0.49
1952 2 26.75 26.39 0.37
1952 3 27.19 26.95 0.24
1952 4 27.81 27.39 0.42
1952 5 27.79 27.56 0.23
1952 6 27.18 27.21 -0.03I want this to plot as graph output but IF theres a negative value, it will also plot as graphs but opposite heres the example graph I want it look like
http://www.pimohweather.com/elninolanina.phpI hope you can hemp me create my own graph menyioned above sample TY
April 28, 2021 at 7:01 pm #34162You need to parse the text file to the format accepted by CanvasJS. Please take a look at this below code snippet for the same.
function handleFiles() {
  var fileList = this.files;
  var reader = new FileReader();

  reader.readAsText(fileList[0]);
  reader.onload = function() {
    renderChart(reader);
  }

}

function renderChart(reader) {
  var dpsList = reader.result;
  var dataPoint;
  var dps1= [], dps2 = [], dps3 = [];

  dpsList = dpsList.split("\n");

  for(var i = 1; i < dpsList.length; i++) {
  	var separateData = dpsList[i].split(" ");
  	yVal = parseFloat(separateData[4]);
        xVal = new Date(parseInt(separateData[0]), parseInt(separateData[1]));

    chart.options.data[0].dataPoints.push({x: xVal, y: yVal});
    chart.options.data[1].dataPoints.push({x: xVal, y: yVal});
  }

  chart.render();
}
Also, check out this JSFiddle for complete working code.
—-
Manoj Mohan
Team CanvasJSJune 5, 2023 at 9:23 am #42935Oh thank You for this but I have another question, how about if theres TWO different data in one text and I want to create a separate graph output in one page?
Example:Mean Surface Air Temperature over Ocean or Land Areas (C)
Annual Mean Anomalies with respect to 1951-1980Year Land_Annual Lowess(5) | Ocean_Annual Lowess(5)
—————————————————–
1880 -0.64 -0.53 | -0.05 0.01
1881 -0.44 -0.56 | 0.01 -0.02
1882 -0.53 -0.60 | 0.00 -0.06
1883 -0.61 -0.62 | -0.06 -0.09
1884 -0.79 -0.65 | -0.15 -0.12
1885 -0.79 -0.67 | -0.21 -0.15
1886 -0.63 -0.66 | -0.21 -0.16
1887 -0.72 -0.63 | -0.24 -0.16
1888 -0.57 -0.58 | -0.05 -0.16
1889 -0.29 -0.55 | -0.04 -0.16
1890 -0.55 -0.53 | -0.29 -0.16
1891 -0.47 -0.51 | -0.13 -0.17
1892 -0.55 -0.51 | -0.18 -0.18
1893 -0.57 -0.50 | -0.23 -0.18
1894 -0.51 -0.48 | -0.26 -0.16
1895 -0.50 -0.43 | -0.14 -0.15
1896 -0.39 -0.38 | 0.00 -0.14
1897 -0.20 -0.31 | -0.05 -0.13
1898 -0.34 -0.24 | -0.23 -0.13
1899 -0.15 -0.20 | -0.16 -0.15
1900 -0.02 -0.18 | -0.07 -0.19
1901 -0.06 -0.18 | -0.18 -0.23
1902 -0.24 -0.19 | -0.26 -0.26
1903 -0.24 -0.21 | -0.41 -0.28
1904 -0.39 -0.25 | -0.51 -0.31
1905 -0.20 -0.28 | -0.28 -0.34
1906 -0.11 -0.31 | -0.26 -0.36
1907 -0.54 -0.32 | -0.32 -0.38
1908 -0.35 -0.34 | -0.47 -0.40
1909 -0.39 -0.36 | -0.52 -0.42
1910 -0.32 -0.37 | -0.49 -0.43
1911 -0.39 -0.34 | -0.47 -0.41
1912 -0.44 -0.30 | -0.31 -0.37
1913 -0.26 -0.29 | -0.37 -0.33
1914 0.00 -0.30 | -0.21 -0.30
1915 -0.06 -0.32 | -0.14 -0.29
1916 -0.43 -0.32 | -0.33 -0.27
1917 -0.63 -0.33 | -0.38 -0.27
1918 -0.45 -0.34 | -0.22 -0.27
1919 -0.28 -0.32 | -0.27 -0.28
1920 -0.29 -0.28 | -0.26 -0.27
1921 -0.03 -0.23 | -0.24 -0.27
1922 -0.23 -0.19 | -0.30 -0.27
1923 -0.20 -0.16 | -0.30 -0.27
1924 -0.19 -0.13 | -0.30 -0.26
1925 -0.08 -0.11 | -0.26 -0.26
1926 0.06 -0.09 | -0.17 -0.26
1927 -0.15 -0.07 | -0.23 -0.25
1928 -0.01 -0.04 | -0.28 -0.24
1929 -0.42 -0.03 | -0.33 -0.24
1930 -0.02 -0.03 | -0.19 -0.24
1931 0.10 -0.02 | -0.16 -0.24
1932 0.07 -0.02 | -0.24 -0.23
1933 -0.26 -0.02 | -0.29 -0.22
1934 0.05 -0.02 | -0.22 -0.22
1935 -0.10 -0.01 | -0.23 -0.20
1936 -0.04 0.02 | -0.19 -0.18
1937 0.04 0.06 | -0.09 -0.14Then I want to create a separate graph for “Land_Annual Lowess(5)” and “Ocean_Annual Lowess(5)
” to give two comparisons of each graph. WHEN it show on graph there will be two graph output. Thank You foor the assitanceJune 5, 2023 at 9:28 am #42936OR if the tx data is this?
Seasonal cycle from MERRA2 using base period 1980-2015
Year Anomaly
1880.04 -2.6
1880.13 -2.4
1880.21 -1.57
1880.29 -0.64
1880.38 0.37
1880.46 0.94
1880.54 1.24
1880.63 1.19
1880.71 0.51
1880.79 -0.59
1880.88 -1.68
1880.96 -2.32
1881.04 -2.62
1881.13 -2.3
1881.21 -1.45
1881.29 -0.43
1881.38 0.53
1881.46 0.96
1881.54 1.42
1881.63 1.25
1881.71 0.51
1881.79 -0.58
1881.88 -1.65
1881.96 -2.22
1882.04 -2.26
1882.13 -2.02
1882.21 -1.44
1882.29 -0.64
1882.38 0.33
1882.46 0.93
1882.54 1.25
1882.63 1.21
1882.71 0.51
1882.79 -0.6
1882.88 -1.63
1882.96 -2.51
1883.04 -2.71
1883.13 -2.53
1883.21 -1.6
1883.29 -0.66
1883.38 0.29
1883.46 1.08
1883.54 1.35
1883.63 1.15
1883.71 0.44
1883.79 -0.47
1883.88 -1.7
1883.96 -2.26
1884.04 -2.55
1884.13 -2.25
1884.21 -1.85
1884.29 -0.88Mostly NEGATIVE value gives confusion to the script?
June 5, 2023 at 6:49 pm #42957how about if theres TWO different data in one text and I want to create a separate graph output in one page?
Example:Mean Surface Air Temperature over Ocean or Land Areas (C)
Annual Mean Anomalies with respect to 1951-1980You can create multiple charts in a single page by providing separate container and options for each chart as shown in this documentation page. In order to use single text file to render multiple charts, you need to parse the data from text file to the format accepted by CanvasJS. Please take a look at the code snippet below for the same.
function handleFiles() {
  var fileList = this.files;
  var reader = new FileReader();

  reader.readAsText(fileList[0]);
  reader.onload = function() {
    renderChart(reader);
  }

}

function renderChart(reader) {
  var dpsList = reader.result;
  var dataPoint;

  dpsList = dpsList.split("\n");

  for(var i = 1; i < dpsList.length; i++) {
    var separateData = dpsList[i].split(" ");
    yValLand = [parseFloat(separateData[1]), parseFloat(separateData[2])];
    yValOcean = [parseFloat(separateData[4]), parseFloat(separateData[5])];
    xVal = new Date(parseInt(separateData[0]), parseInt(separateData[1]));

    landTempChart.options.data[0].dataPoints.push({x: xVal, y: yValLand})
    oceanTempChart.options.data[0].dataPoints.push({x: xVal, y: yValOcean})
  }

  landTempChart.render();
  oceanTempChart.render();
}
Also, check out this JSFiddle for complete working code.
OR if the tx data is this?
Seasonal cycle from MERRA2 using base period 1980-2015
Year Anomaly
1880.04 -2.6
1880.13 -2.4
1880.21 -1.57
1880.29 -0.64….Can you kindly brief us further more about your requirement so that we can understand your scenario better and help you out?
—–
Manoj Mohan
Team CanvasJS
Tagged: line graph Plot
You must be logged in to reply to this topic.