@jimginn,
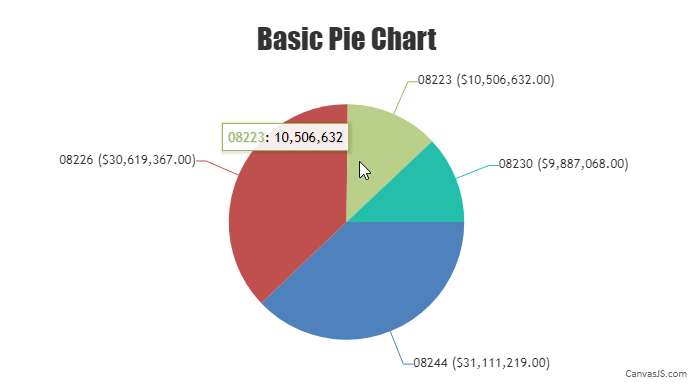
Since you are trying to use two values(y-value & label) in indexLabel, using indexLabelFormatter and formatNumber method to customize each of the values before displaying them as indexLabel should work fine. The code snippet below shows how you can achieve the same:
indexLabelFormatter: function(e){
      return CanvasJS.formatNumber(e.dataPoint.label, "0####") + " (" + CanvasJS.formatNumber(e.dataPoint.y, "$#,##0.00\"\"") + ") " ;
    }
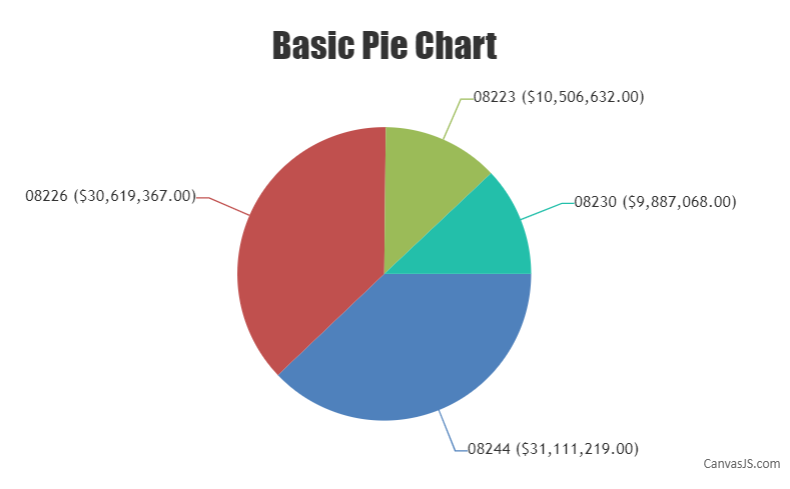
Please take a look at this JSFiddle for a working example with sample code.
—
Shashi Ranjan
Team CanvasJS
.