Login to Ask a Question or Reply
You must be logged in to post your query.
Home › Forums › StockChart Support › onChange handler for stock chart slider ?
onChange handler for stock chart slider ?
- This topic has 2 replies, 2 voices, and was last updated 5 years, 1 month ago by
Indranil.
Tagged: navigator slider column
-
June 15, 2021 at 6:21 am #34635
Hello, My use case is to have a slider on a stacked column chart with in a certain date range. Once user selects a range, I would need to fetch data for that range and show it in a preview below in a different component – say a table.
So now, can I use a slider on a stacked column chart directly instead of using a navigator? If not, I am planning on using a navigator and hide the main chart and just show the navigator. Does that work.
Also, I find that we have a get and set methods, but can I react to use changes on slider? like handleChange kind of an event handler?
I appreciate any help. Thanks.
June 15, 2021 at 8:01 pm #34642Looks like rangeChanged is what I am looking for. Can anyone help me with my other questions?
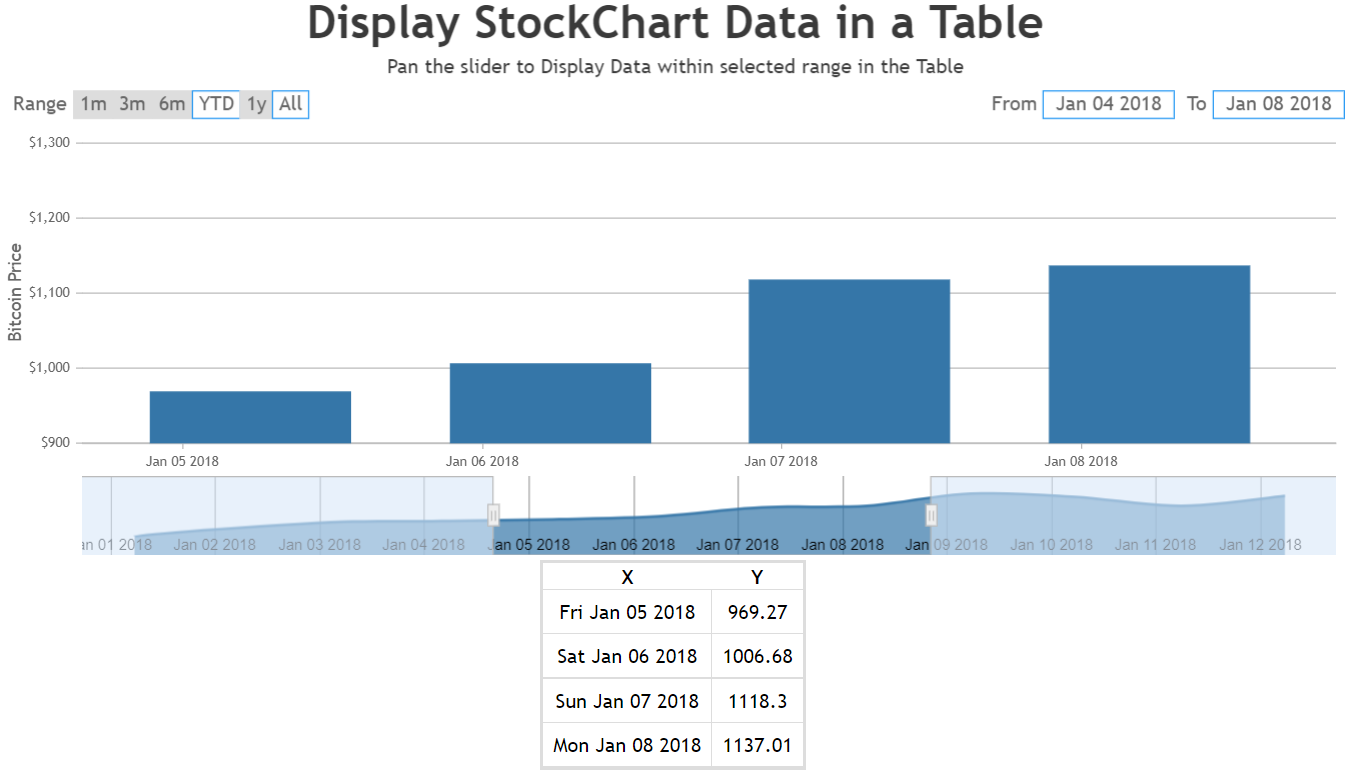
June 17, 2021 at 5:39 am #34667You can set a rangeChanged event handler that would filter out the data present within the selected region of the slider, then use the same data to populate the table as shown below –
updateTableData(e){
  var dpsInViewPort = [];
  for(var i = 0; i < stockChart.charts[0].data[0].dataPoints.length; i++) {
    if(stockChart.charts[0].data[0].dataPoints[i].x.getTime() >= stockChart.navigator.slider.minimum && stockChart.charts[0].data[0].dataPoints[i].x.getTime() < stockChart.navigator.slider.maximum) {
      dpsInViewPort.push({x: stockChart.charts[0].data[0].dataPoints[i].x.toDateString(), y: stockChart.charts[0].data[0].dataPoints[i].y});
    }
  }
  if(e.source === "navigator" || e.source === "inputFields" || e.source === "buttons")
    this.setState({
      tableData: dpsInViewPort
    });
  else{
    if(!this.state.isPopulated)
      this.setState({
        tableData: dpsInViewPort,
        isPopulated: true
      });
  }
}

renderTableHeader() {
  let tableData = this.state.tableData[0];
  let header = [];

  for(var key in tableData) {
    if(tableData.hasOwnProperty(key)) {
      header.push(key);
    }
  }

  return header.map((key, index) => {
    return <th key={index}>{key.toUpperCase()}</th>
  })
}

renderTable() {
  return this.state.tableData.map((tableData, index) => {
    const { x, y } = tableData;
    return (
      <tr key={index}><td>{x}</td><td>{y}</td></tr>
    );
  });
}
.
.
.
.
.
return (
   <div>
     <div>
       {
         this.state.isLoaded &&
         <CanvasJSStockChart containerProps={containerProps} options = {options} onRef={ref => stockChart = ref}
         />
       }
     </div>
     <table id="chartData">
       <tbody>
         <tr>{this.renderTableHeader()}</tr>
         {this.renderTable()}
       </tbody>
     </table>
   </div>
);
Please take a look at this StackBlitz example to display stockChart data in a table.
Also, you can easily hide the chart in StockChart and just use the navigator with the slider functionality by customizing the height property of chart as shown in the code snippet below –
const options = {
  animationEnabled: true,
  exportEnabled: true,
  theme: "light2",
  charts: [{
    height: 1,  //setting height property of the chart
    data: [{
      type: "candlestick",
      dataPoints: stockData
    }]
  }],
  navigator: {
    height: 150,
    slider: {
      minimum: new Date("2018-05-01"),
      maximum: new Date("2018-07-01")
    }
  }
};
Kindly take a look at this StackBlitz for an example with complete code.
___________
Indranil Deo
Team CanvasJS
Tagged: navigator slider column
You must be logged in to reply to this topic.